
A complete guide to LLM observability with OpenTelemetry and Grafana Cloud
In the fast-paced world of technology, change is constant — and nowhere is that more evident today than in the flood of new features and advancements involving large language models (LLMs). They power various applications, from chat bots to advanced copilots. And as these LLMs and applications become more sophisticated, it will be vital that they work well and reliably. This is where observability, with the help of OpenTelemetry (using OpenLIT), plays an essential role.
Let’s explore why monitoring LLM applications is so important and how you can do it more easily using OpenTelemetry, Grafana Cloud, and OpenLIT, an open source LLM observability tool built on OpenTelemetry.
How does an LLM application work?
Before we take a closer look at LLM observability, we thought it would be helpful to take a step back for those who are still new to this space, so they can understand what these apps entail.
Imagine an application like ChatGPT, which is a chatbot powered by an LLM (e.g., GPT-3.5). When you ask ChatGPT a question, it processes your input and responds accordingly.

Here’s a simplified breakdown of what’s happening behind the scenes:
- User input: The user types a prompt or question.
- Processing: The backend application (typically written in Python) sends this request to the language model.
- Response: The model processes the input and sends back a response.
- Display: The response is displayed to the user in the chat interface.

Why observability matters for LLM applications
Observability helps you understand what’s happening inside your LLM application. Here are some crucial questions it can help answer:
- How often are requests made to the LLM provider (e.g., OpenAI)?
- Tracking request frequency helps manage usage and avoid unexpected costs.
- How long does it take to get a response?
- Monitoring response times ensures the application runs efficiently and helps identify any latency issues.
- Will the requests to the LLM provider cause rate-limiting issues?
- Observing request rates can prevent disruptions caused by exceeding rate limits.
- Is the support bot providing helpful and accurate responses?
- Evaluating response quality helps improve user satisfaction and identifies model performance issues.
- How much does it cost to run the LLM feature in production?
- Tracking costs aids in budget management and decision-making for scaling the application.
- When did the LLM start giving irrelevant or incorrect responses (hallucinations)?
- Detecting anomalies early allows you to address issues promptly.
- What are users asking the support bot?
- Analyzing user queries helps understand user needs and enhance the bot’s responses.
Why OpenTelemetry (and Grafana Cloud) is the right choice
OpenTelemetry is an open source framework for observability. It collects and exports monitoring data in a vendor-neutral way, setting standards for data collection and processing. It’s particularly well-suited for LLM applications because it works with many monitoring tools, like Grafana Cloud.
For LLM applications, tracking the sequence of operations (traces) is critical. This is especially true when using orchestration frameworks like LangChain or LlamaIndex. Tracing helps understand the workflow, making debugging and root cause analysis more straightforward and effective.
Grafana Cloud is also built on an open source framework, and it includes a large ecosystem of data sources and integrations — including OpenTelemetry — you can use to unify and correlate disparate LLM data. Moreover, it’s composable, so you rely on Grafana Cloud Traces or bring your own traces tooling.
Plus, Grafana provides customizable dashboards that bring your telemetry data to life. Whether you’re tracking API latencies or understanding query efficiencies, Grafana’s versatile platform supports dynamic, insightful visualizations.
What to track: key signals to monitor
LLMs are different from traditional machine learning models, often accessed through external API calls. Capturing the sequence of events through traces is crucial, especially in a RAG-based application where events can occur before and after the use of LLMs. Additionally, analyzing aggregated data through metrics offers a quick overview of aspects such as requests, tokens, and costs, which is important for optimizing performance and managing expenses.
Key signals to monitor include:
Traces
Request metadata
- Temperature: Measures how creative or random the output should be
- Top_p: Controls how selective the model is with its output choices
- Model name or version: Tracks performance changes with updates
- Prompt details: The inputs sent to the LLM, which can vary widely
Response metadata
- Tokens: Impacts cost and measures response length
- Cost: Important for budgeting and managing expenses
- Response details: Characteristics of model outputs and potential inefficiencies
Metrics
- Request volume: Total number of requests to understand usage patterns.
- Request duration: Time taken to process each request, including network latency and response generation time.
- Costs and tokens counters: Tracking costs and tokens over time for budgeting and cost optimization.
Why this isn’t just plain API monitoring
While LLM observability does involve monitoring external API calls to LLMs, it goes much further than traditional API monitoring. In standard API monitoring, the focus is primarily on request and error tracking. However, LLM observability captures detailed and valuable information, such as prompts, responses, associated costs, and token usage.
This rich data set offers a more comprehensive view of the application’s performance, giving you deeper insights into areas like prompt evaluation, model performance, and more. The goal is not just to monitor API requests but to understand the intricacies of how your LLM is functioning and performing within your application.
Tutorial: Automatic instrumentation for LLMs applications with OpenLIT
OpenLIT offers a simple path to automated instrumentation. With the OpenLIT SDK, developers can capture essential telemetry data automatically. Here’s how you can set it up.
1. Install OpenLIT SDK:
pip install openlit
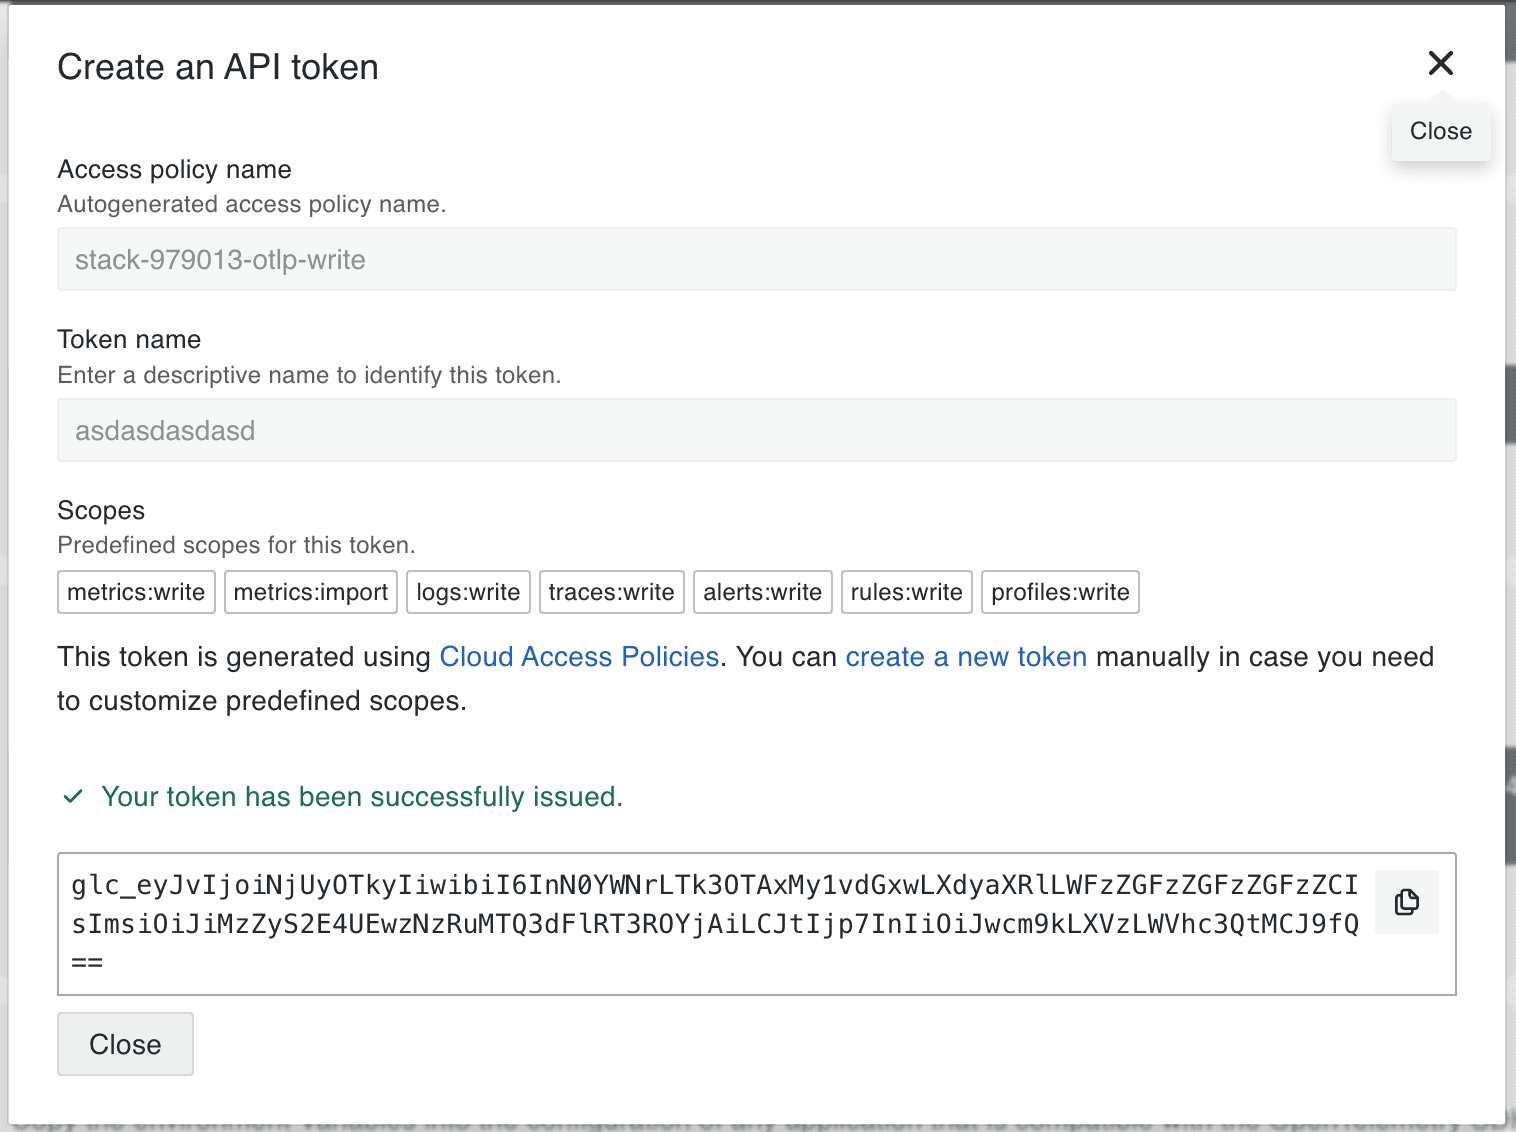
2. Get your Grafana Cloud credentials:
- Log in to Grafana Cloud and select your Grafana Cloud Stack. (If you don’t already have one, you can create a forever-free account today.)
- Click on the OpenTelemetry card
- Under the “Password / API Token” section, click Generate an API token.

- Enter a name for the token and click Create.
- Now, under the Environment Variables section:
- Copy and save the values for
OTEL_EXPORTER_OTLP_ENDPOINTandOTEL_EXPORTER_OTLP_HEADERS.

3. Set the OTEL endpoint and headers as ENV:
 export OTEL_EXPORTER_OTLP_ENDPOINT="YOUR_GRAFANA_OTEL_GATEWAY_URL"

 export OTEL_EXPORTER_OTLP_HEADERS="YOUR_GRAFANA_OTEL_GATEWAY_AUTH"
Replace placeholders with actual values:
- Example OTLP gateway URL:
https://otlp-gateway-<zone>.grafana.net/otlp - Example OTLP headers:
Authorization=Basic%20<base64_encoded_Instance_ID_and_API_Token>
Note: Replace the space after
Basicwith%20: OTEL_EXPORTER_OTLP_HEADERS=“Authorization=Basic%20[base64 instanceID:token]”
4. Initialize the SDK:
 import openlit

 openlit.init()
You can also customize the application name and environment according to your needs. This will help you monitor and aggregate metrics and traces according to the environment and application:
openlit.init(application_name="YourAppName", environment="Production")
Visualize time series using a Grafana dashboard
Once your LLM application is instrumented with OpenTelemetry, the next step is to visualize and analyze the data to better understand your application’s performance and behavior.Here is a dashboard you can import (Thanks to the OpenLIT Team for building this!) to quickly get started with visualization in Grafana.


Breakdown of panels and their benefits
The OpenLIT dashboard offers a comprehensive view of your application’s performance, helping you enhance efficiency, manage costs, and ensure the reliability of your LLM application.
For example, it tracks successful requests, providing insights into usage patterns and potential issues while detailing request durations to identify latency problems and optimization opportunities in external LLM API calls. By monitoring request rates, you can avoid exceeding the limits set by LLM providers.
Cost management is also streamlined with total and average usage cost insights, aiding in budget planning and evaluating cost-effectiveness. The dashboard also identifies the most frequently used GenAI models, enabling you to prioritize resources and assess model performance. Detailed segmentation by platform, request type, and environment ensures a granular understanding of usage, supporting consistent performance across various settings. Additionally, comparing token consumption with usage costs helps optimize efficiency and forecast budgets.
This approach allows you to better understand usage patterns, improve resource allocation, and identify potential bottlenecks, ultimately leading to a more efficient application.
Next steps
The setup we discussed here is just one way you can use open source tools to observe LLMs. For example, I recently wrote about how to set up LLM observability using Grafana OSS, Prometheus, and Jaeger for the official OpenTelemetry blog. Alternatively, if you are interested in using self-hosted Prometheus and Grafana Tempo with Grafana OSS, you can refer to the OpenLIT guide, which is available here.
If you have any questions or are interested in learning more about LLM observability, we’d love to hear from you. You can reach out to me at ishan.jain@grafana.com for any questions about setting up LLM observability with Grafana Cloud.
Grafana Cloudis the easiest way to get started with metrics, logs, traces, dashboards, and more. We have a generous forever-free tier and plans for every use case. Sign up for free now!

