
Grafana Cloud updates: Kubernetes Monitoring enhancements, browser tests in Grafana Cloud k6, and more
We consistently roll out helpful updates and fun features in Grafana Cloud, our fully managed observability platform powered by the open source Grafana LGTM Stack (Loki for logs, Grafana for visualization, Tempo for traces, and Mimir for metrics).
In case you missed it, here’s a roundup of the latest and greatest updates for Grafana Cloud this month. You can also read about all the features we add to Grafana Cloud in our What’s New in Grafana Cloud documentation.
And if you’re not a Grafana Cloud user yet, sign up for an account today! You can try any of these features (and more) for free with our generous Cloud Free plan.
Improvements to Kubernetes Monitoring
This month, we’re excited to share various improvements to Kubernetes Monitoring in Grafana Cloud, including new visualizations to help you monitor costs and network bandwidth, along with new tools to streamline troubleshooting.
New visualizations for cost, resource management
As a Kubernetes fleet scales, the associated cloud costs can rise quickly. To help you combat that, and to provide comprehensive insights into your spending, we’ve made cost management a major component of our Kubernetes Monitoring solution.
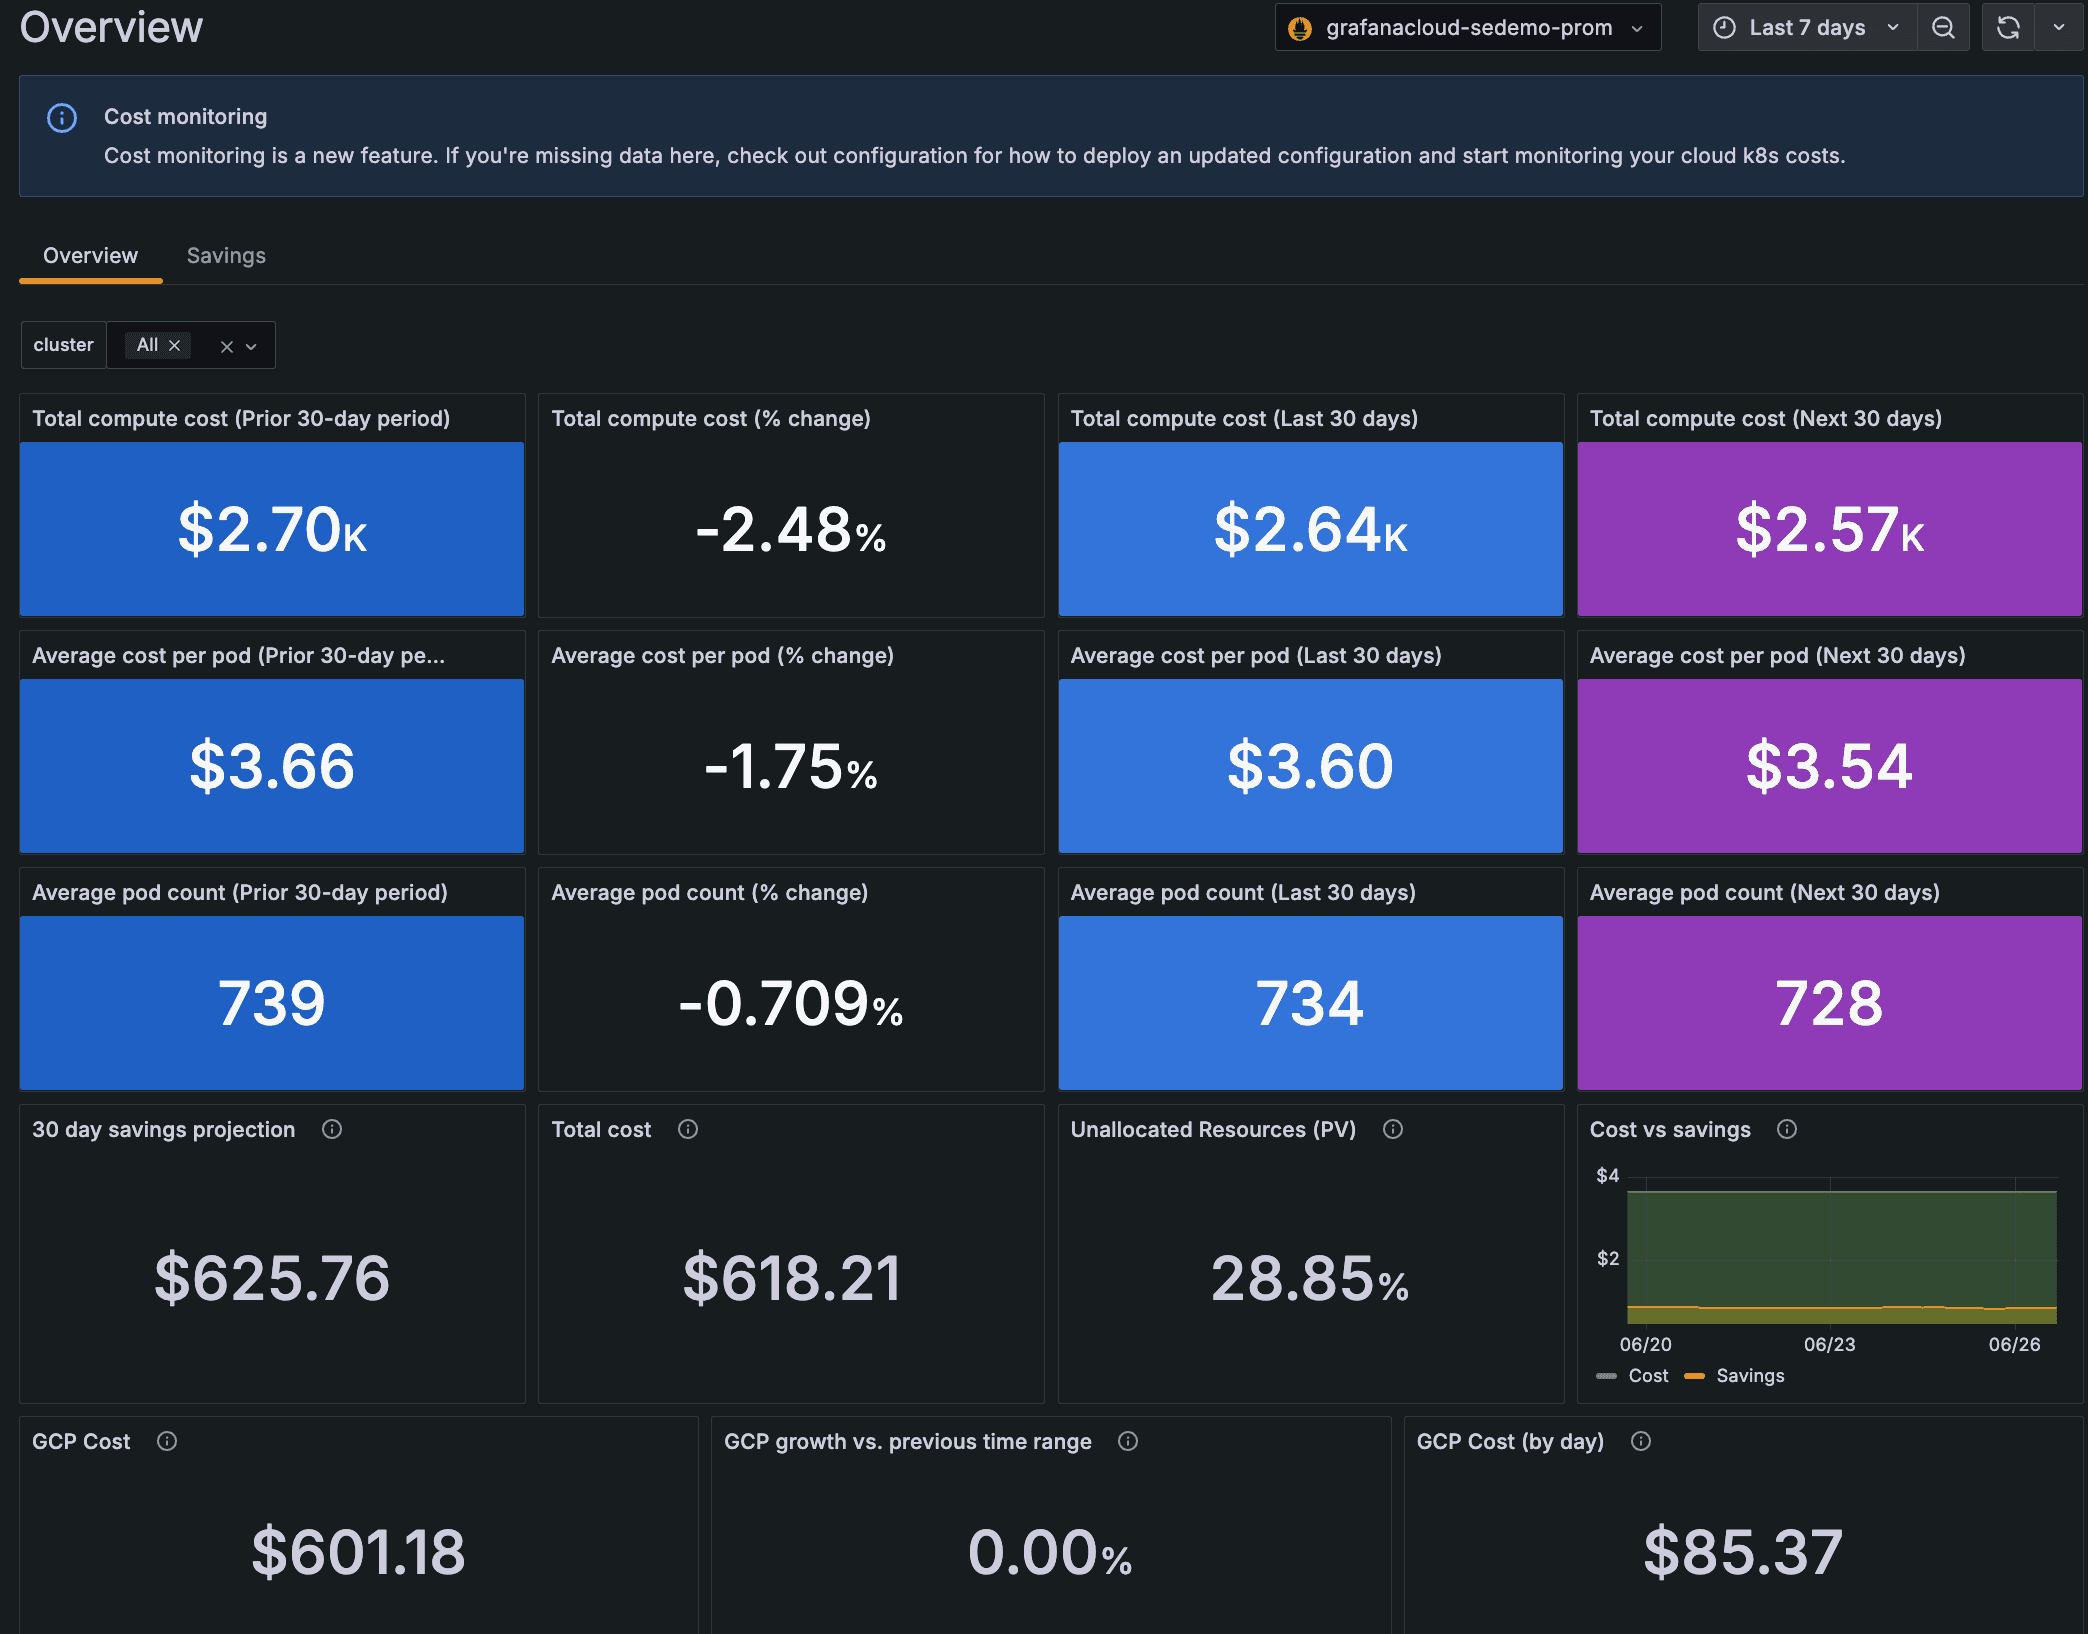
Most recently, we introduced the Cost Overview tab, where panels display a 90-day view of total compute cost, average cost per pod, and average pod count. This 90-day period includes the past 30 days, as well as the 30 days before and after that window.
You can also see the cost (calculated within the selected time range) of each cloud service provider you use, along with the total cost of all providers, a 30-day projected cost of idle CPU cores, and the percentage of unclaimed Persistent Volumes.
We also know it’s important to keep close tabs on resource usage within your Kubernetes deployment. That’s why, on every detail page for a cluster, namespace, workload, node, or pod, you can now view the following data:
- Network bandwidth: Shows the rate of received and transmitted bytes.
- Network saturation: Shows the rate of received and transmitted packets dropped.

Faster and easier troubleshooting
We’ve introduced a few new troubleshooting methods within Kubernetes Monitoring, including the ability to:
- Find deleted objects, such as clusters, nodes, pods, containers, workloads, and namespaces.
- Zoom into a specific area on a graph to narrow a time range.
- Jump directly to the list of clusters, nodes, workloads, and alerts from the home page.
Let’s take a closer look at each.
Find deleted objects
You can now find deleted objects to gain a better understanding of events that occurred in the past. To do so, set the time range selector to a past time period.
The following example shows a time range of the previous 30 days, and then filters for nodes with the condition “No data.” The Node detail page then shows a graph, depicting when the node expired.

Zoom in to refine a time range
It’s now possible to zoom in on a graph to narrow a time range for more targeted historical analysis. You can use this feature to understand, for example, the historical pattern of CPU usage and memory usage during a specific time period. The time range will remain selected until you click Back to default.
Jump directly to clusters, nodes, workloads, and alerts
From the home page, you can now jump directly to your list of clusters, nodes, and workloads.

To learn more about Kubernetes Monitoring in Grafana Cloud, check out our technical docs.
Browser tests in Grafana Cloud k6
For the past few months, we’ve been working on stabilizing the k6-browser module and its API, which help you simulate how users interact with a browser page and collect performance metrics about that interaction. We’ve also been working hard to improve the performance of Grafana Cloud k6 when handling browser tests with a high number of virtual users (VUs).
This month, we’re excited to share that browser tests in Grafana Cloud k6 are generally available! You can now run browser tests with multiple VUs to better understand the user experience, as well as identify and fix frontend performance issues.
As part of this release, we’re also introducing the browser timeline and browser screenshots features:
- Browser timeline: The Grafana k6 browser module now uses OpenTelemetry to generate spans and traces that match a virtual user’s behavior and browser interactions as they execute the code in your test script. The results are streamed to Grafana Cloud k6 and displayed in the Browser Timeline section of the test results page, offering a detailed timeline of your browser test. You can visualize details such as load time, Web Vital metrics, and executed methods for each page in your script to get a better understanding of app performance.

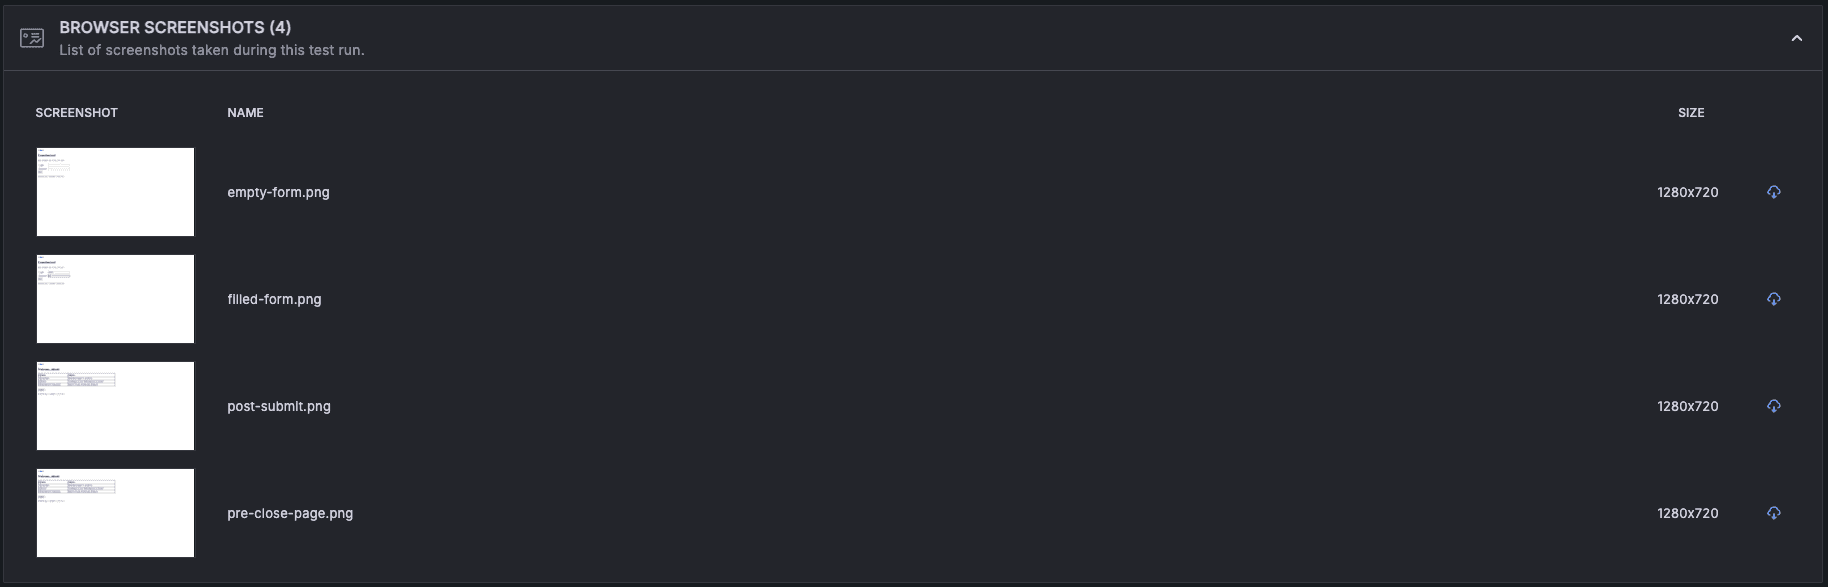
- Browser screenshots: This feature lets you view screenshots taken with the
page.screenshotmethod during your browser tests. You can click on each screenshot thumbnail to open a dialog box that shows the expanded image, and also download the image file.
For more details on browser tests in Grafana Cloud k6, refer to our technical docs.
Explore Logs is in public preview
Explore Logs is now available to most Grafana Cloud users in public preview! Introduced at GrafanaCON 2024, Explore Logs helps developers quickly troubleshoot and gain insights from their logs — without needing to write LogQL queries.
Explore Logs also enables development teams to:
- Quickly identify changes in behavior by looking at services in histograms
- Identify repeated log lines using the patterns feature
- Easily remember and share state with teammates
- Progressively drill down to root causes, using visual cues and point-and-click experiences

To learn more, check out our technical docs.
Data visualization updates
New features in Scenes-powered dashboards
With the Grafana 10 release, we announced Scenes, our new frontend framework for Grafana dashboards. Now everything that comprises a dashboard — panels, variables, rows, time range, transformations, and sections — is a component that a developer can incorporate into an app.
For the past few months, we’ve been working on a major update of our dashboards architecture and migrated it to the Scenes library, providing us with more stable, dynamic, and flexible dashboards. As part of that update, we are introducing:
- Edit mode: It’s sometimes hard to navigate through all the visual options during the dashboard editing process. With the introduction of Edit mode, we provide an easier way to discover and interact with the dashboard editing experience.
- Fixed positioning of template variables and time picker: We moved the time picker into the dashboard canvas and now, together with template variables, it will stick to the top as you scroll through your dashboard. This has been a highly requested feature that we’re excited to roll out to the community.
Read more about our new Scenes-powered dashboards in our technical docs.
Data link improvements in canvas visualizations
We’ve updated canvas visualizations so that you can add data links — which allow you to link to other panels, dashboards, and external resources while maintaining the context of the source panel — to canvas elements without using an override. The Selected element configuration now includes a Data links section where you can add data links to elements using the same steps as in other visualizations.
You can configure data links in canvas elements to open with a single click. To enable this functionality, toggle the One-click switch in the Selected element data link options. If there are multiple data links for an element, the first link in the list has the one-click functionality.
As part of this improvement, we’ve also added the ability to control the order in which data links are displayed by dragging and dropping them. This improvement has been added to all visualizations.

Grafana Cloud Traces and RetryInfo
Grafana Cloud Traces will now return RetryInfo to correctly indicate retryable errors. This change aligns with the OpenTelemetry specification, which states that when retryable errors indicate that telemetry data processing failed, the client should record the error and may retry exporting that same data. This can happen, for example, when a server is temporarily unable to process data.
If an error is retryable, the collector keeps the data and attempts to send again after the interval returned by the server.
For more information, refer to our Retry on RESOURCE_EXHAUSTED failure page.
Integrations and data source plugins
- Supabase: You can now easily monitor Supabase, an open source, Firebase-compatible solution, within Grafana Cloud. The integration also includes a pre-built dashboard to give you a comprehensive overview of Supabase performance metrics.
- GitLab: We recently released v2.0 of the GitLab Enterprise data source plugin. The plugin was updated to the latest GitLab API version, which comes with some potential breaking changes to the Projects queries:
- The public field has been removed. Instead, the existing visibility field should be used.
- public_builds are now called public_jobs.
- Adobe Analytics: The new Adobe Analytics Enterprise data source plugin allows you to retrieve and visualize reports data from Adobe Analytics.
Grafana Cloud is the easiest way to get started with metrics, logs, traces, dashboards, and more. We have a generous forever-free tier and plans for every use case. Sign up for free now!

