Obirdability: How to build an observability system for bird songs 🎶
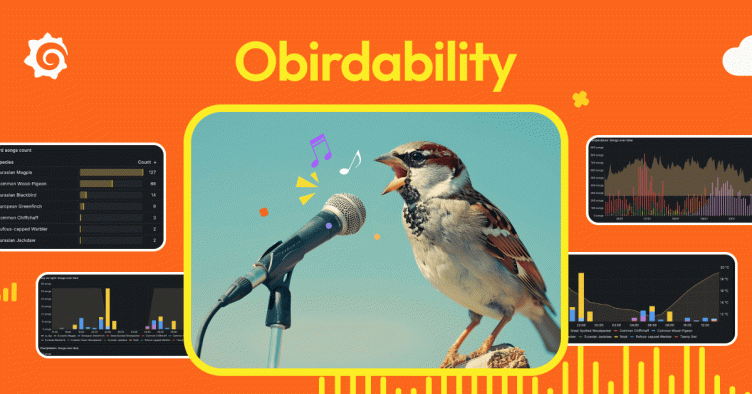
What are those birds I hear when I wake up? What’s the most common bird in my garden? These are the types of questions, along with our general curiosity about the world around us, that motivated us to build an observability system for bird songs — a system you can replicate at home to learn more about the sweet tweets in your backyard, too!
In this blog post, we’ll demonstrate how to harness open source tools like BirdNET, Prometheus, Grafana Loki, and Grafana to monitor and analyze bird songs, which, it turns out, can also be good for your mental health.
There’s supposed to be a video here, but for some reason there isn’t. Either we entered the id wrong (oops!), or Vimeo is down. If it’s the latter, we’d expect they’ll be back up and running soon. In the meantime, check out our blog!
And while we’ll focus on bird observability, the insights and techniques shared here offer valuable lessons for a much broader range of fields. We’ll explore how to select and obtain important data, visualize it in beautiful dashboards, conduct ad hoc investigations, and make the data actionable.
Join us on this journey to uncover the secrets of bird song and the power of observability.
Configure Raspberry Pi, BirdNET, and Grafana Alloy
First and foremost we need to set up the hardware necessary to record bird songs, analyze them locally, and send them to Grafana Cloud for storing and visualizing.

For the microphone we’ll use a rather cheap ~30 EUR microphone from Amazon together with a rather long USB type C cable. That cable connects to a Raspberry Pi 4. (For our purposes we just went with a basic microphone, but if you are interested in using a better one, take a look at this suggestion thread.)
Next we need to set up our system to record bird songs and detect different species. Luckily there is an open source application that does exactly that. The system is called BirdNET and it is an open source, AI-powered bird sound recognition framework. The recorded audio stays on the system and it can detect over 6,000 species, mostly across North America and Europe.
BirdNET’s best-known tools are their mobile applications. Just install it on your phone, record a bird, and learn about the species you just heard. Besides these mobile apps, BirdNET’s open source recognition framework can be used for all kinds of applications, like the one we are talking about in this blog post.
Did you know? BirdNET has a map with live submissions that shows observations all across the world. Head to https://birdnet.cornell.edu/map to see submissions in your area.
If you want to learn more how BirdNET works, checkout our GrafanaCON 2024 talk:
Before we set up the hardware in the right location, we need to configure the Raspberry Pi. We’ll use BirdNET to analyze bird sounds locally on the Raspberry Pi, and Grafana Alloy to push telemetry data to Grafana Cloud. Thankfully, BirdNET logs all detections in a convenient way:
Mar 15 10:44:15 birdnetpi birdnet_analysis.sh[919681]: 18.0;21.0-('Chloris chloris_European Greenfinch', 0.4028826)We can see the time of detection, the species name (in Latin and English), and a percentage value between 0 and 1. This value represents the confidence that BirdNET accurately identified the specific species. In this case we can be ~40% confident that the recorded audio is a European Greenfinch.
To easily get BirdNET on the Raspberry Pi we’ll use this BirdNET-Pi repository. This repository is built on the BirdNET framework and provides a simple and easy-to-follow installation guideline.
To store telemetry and avoid hosting our own Grafana OSS, we will use Grafana Cloud. Grafana Cloud offers a free service that not only includes the use of a Grafana instance, but also free storage of logs, metrics, traces, and profiles.
To get the described logs into a Grafana Cloud Logs (powered by Loki) instance, we will use Grafana Alloy. To get it on the Raspberry Pi, just follow the installation instructions for Linux. For the configuration, we will be using the following /etc/alloy/config.alloy file:
loki.source.journal "read" {
    relabel_rules = loki.relabel.journal.rules
    forward_to = [loki.process.local.receiver]
}

loki.relabel "journal" {
    forward_to = []
    rule {
        source_labels = ["__journal__systemd_unit"]
        target_label = "unit"
    }
}

loki.process "local" {
    stage.match {
        selector = "{unit=\"birdnet_analysis.service\"}"

        stage.regex {
            expression = ".+\\('(?P<species_latin>.+?)_(?P<species>.+?)', (?P<confidence>.+?)\\)"
        }

        stage.labels {
            values = {
                species = "",
                species_latin = "",
                confidence = "",
            }
        }
    }
    stage.match {
        selector = "{unit=\"birdnet_analysis.service\"} |= \", 0.5\""

        stage.static_labels {
            values = {
                confidence_interval = "0.5",
            }
        }
    }
    stage.match {
        selector = "{unit=\"birdnet_analysis.service\"} |= \", 0.6\""

        stage.static_labels {
            values = {
                confidence_interval = "0.6",
            }
        }
    }
    stage.match {
        selector = "{unit=\"birdnet_analysis.service\"} |= \", 0.7\""

        stage.static_labels {
            values = {
                confidence_interval = "0.7",
            }
        }
    }
    stage.match {
        selector = "{unit=\"birdnet_analysis.service\"} |= \", 0.8\""

        stage.static_labels {
            values = {
                confidence_interval = "0.8",
            }
        }
    }
    stage.match {
        selector = "{unit=\"birdnet_analysis.service\"} |= \", 0.9\""

        stage.static_labels {
            values = {
                confidence_interval = "0.9",
            }
        }
    }
    stage.match {
        selector = "{unit=\"birdnet_analysis.service\"} |= \", 1.\""

        stage.static_labels {
            values = {
                confidence_interval = "1",
            }
        }
    }
    stage.match {
	  selector = "{unit=\"birdnet_analysis.service\"}"

	  stage.pack {
            labels = ["confidence"]
        }
    }

    forward_to = [loki.write.cloud.receiver]
}

loki.write "cloud" {
    endpoint {
        url = "URL_FROM_GRAFANACLOUD"
        basic_auth {
            username = "USERNAME_FROM_GRAFANACLOUD"
            password = "PASSWORD_FROM_GRAFANACLOUD"
        }
    }
}
The values URL_FROM_GRAFANACLOUD, USERNAME_FROM_GRAFANACLOUD, and PASSWORD_FROM_GRAFANACLOUD are taken from the Grafana Cloud configuration page at https://grafana.com/orgs/YOUR_ORG_SLUG.
This configuration will:
- Read logs from the
birdnet_analysis.service - Parse the species in both languages and the confidence with a
regexstage and define those values as labels - Group confidence values by adding a
confidence_intervallabel, which rounds the confidence value to the nearest decimal point - Use the
pack stageto not create labels with too high cardinality - Push the logs into a Grafana Cloud Logs instance
Use this dashboard to get an overview of the species that can be heard and seen in your garden.

Adding context to BirdNET data
Now that we have the main data in the form of bird songs 🎶, we can start looking at other data that would provide additional context.
One of the best things about using Grafana is that you don’t need all your data in one place. Data can come from various sources, and you can easily connect it in your Grafana dashboard or even a single panel. We searched the internet for data that would provide context to bird songs, and here’s what we found.
Bird species info
We’ll use the Wikipedia API to get short descriptions, pictures, and audio clips of bird songs for each bird species. These are then displayed using the Dynamic Text panel in the preferred format, such as audio controls, images, or information cards. To query Wikipedia, we’ll use the Infinity data source, which lets us query different APIs and transform the results as needed. In this case, we don’t need to set up authentication as Wikipedia does not require any API key to query its data. We’ll then use the following GET API requests, where $species is the actual bird species (for example, Canada Goose):
- Retrieve and display thumbnail image of the bird
https://en.wikipedia.org/api/rest_v1/page/summary/$species?action=query&prop=pageimages|pageprops&format=json&piprop=thumbnail&pithumbsize=300- Fetch and display a brief description of the bird species
https://en.wikipedia.org/api/rest_v1/page/summary/$species- Add audio clips associated with the bird species
https://en.wikipedia.org/w/api.php?action=query&titles=$species&generator=images&prop=imageinfo&iiprop=mediatype|url&format=json&redirects=trueWe then display the received data using a Dynamic Text panel that converts the text data into the preferred format — such as audio controls, images, or information cards.

To show bird species information for each detected bird, we’ll use repeated rows. You can find more information on how to use repeated rows in our “Learn Grafana: How to Automatically Repeat Rows and Panels in Dynamic Dashboards” tutorial.
Weather information
For weather information — such as temperature, humidity, wind speed, sunshine duration, or precipitation — we’ll use data from Open-Meteo, as it provides accurate weather data, and it’s free and easy to use. This helps us understand what weather factors might have influenced the birds when the bird songs were recorded. To query Open-Meteo, we can use the previously set up Infinity data source, as Open-Meteo does not require any API key to query data as well.
Open-Meteo provides access to various types of data, which can be queried at different frequencies, such as hourly or daily. For example, to get daily average temperature data, you can use the following API request as inspiration — replace $lat, $long, and $tz with your actual latitude, longitude, and timezone:
https://archive-api.open-meteo.com/v1/era5?latitude=$lat&timezone=$tz&longitude=$long&daily=temperature_2m_mean&start_date=${__from:date:YYYY-MM-DD}&end_date=${__to:date:YYYY-MM-DD}You can find more options and details in Open-Meteo documentation.
To visualize weather data alongside bird song data in one panel, we’ll use the Mixed data sources, which allows you to run queries from different data sources. The data is then displayed in a time series panel.


WAQI for pollution data
For pollution data, we’ll use the World Air Quality Index (WAQI), which provides free and real-time air quality data around the world. To query WAQI, we need to create an API token first. After obtaining the API key, we can create a new Infinity data source and set up authentication.
To do so, choose the API Key Value pair authentication option and add a “token” as our key and the API key we obtained as the value. In the “Add to” option, select Query Param, then enter “https://api.waqi.info” under “Allowed hosts.” When this is set up, we can follow the API documentation to get PM10, PM2.5 and AQI data.

Unfortunately, WAQI only gives free pollution data for the last three days, but in our dashboard we need it for every day. To get around this, we use a Grafana feature called recorded queries. With recorded queries, Grafana runs a query to the WAQI website every hour and stores the results in Grafana Cloud Metrics, which is powered by Grafana Mimir. We then use Mimir data source to query air pollution data.
You can use the following API request as inspiration for a recorded query — replace $city with actual token and your city.
https://api.waqi.info/feed/$city
Click on the Recording queries button and use the query in the screenshot above to create a recorded query.

Once you click on Start recording query, your query will be set up, and the values will be saved in Mimir. You can then query your Grafana Cloud Metrics data source to visualize air pollution data.

Google Sheets for local observations
Sometimes there are ad hoc factors that are hard to track in any way other than just documenting them on your own. For example, construction work, garden parties, fireworks, or fires. To document all of these, we use simple Google Sheets spreadsheets.

We then use the Google Sheets data source to query our spreadsheet and visualize these events as annotations to make it clear when and what was happening and if it had any significant effect on bird songs.

To visualize the data, you can build your own dashboards or import the following pre-built dashboard available here: Obirdability: Bird song monitoring.

Receiving bird alerts with Grafana and Pushover
Now that we have our dashboards ready, we can make our data actionable through alerts. For example, we can set up an alert for our favorite bird so that we receive notifications about it. To do this, we use Grafana Alerting.
Contact points
Let’s start with setting up contact points, which are the methods by which we get notified about alerts. Go to Home > Alerts & IRM > Alerting > Contact points and click on + Add contact point. Choose and fill out the notification method, then save it. The easiest method is **"**Email," where you just add a comma-separated list of emails that will be notified when an alert fires. However, we recommend using the “Pushover” method, which lets you receive push notifications on your phone or smartwatch.
Pushover
To use push notifications, you will need to get a Pushover user key and API token.
- Go to Pushover signup and create a new account. You will then receive your user key.
- Click on Create New Application/API Token, give it a name, and click on Create Application. You will then receive an API token.
Go back to Grafana and enter the user key and API token in the appropriate fields and save.

Next, download the Pushover app to your phone and log in.
Setting up alert rules
In Grafana Alerting, the first step is to set up alert rules. For example, here is an alert query to notify us about the Atlantic Puffin:
sum by (species) (count_over_time({unit="birdnet_analysis.service", species="Atlantic Puffin"} | unpack | confidence > 0.75 | __error__=`` [$__auto]))Next, we set up a Threshold for how many bird songs need to be recorded for the alert to fire. In our case, we want anything above 0 to trigger the alert. The Pending period is set to 0s because we want to be notified as soon as possible.

In the “Notifications” section, choose the newly created Pushover notification as the contact point and save. Now, whenever the alert you have set up is triggered, you will receive a notification on your phone, allowing you to check out the bird!

We love to hear bird songs, but we also want to hear from you!
We hope you had a hoot setting up your own “obirdability” system. If you’re eager to dive deeper, don’t miss the GrafanaCON 2024 talk about it. But most importantly: share your bird tales with us! Did you spot any feathered celebrities in your backyard? Tweet us at @svennergr and @ivanahuckova and don’t forget to tag @grafana — extra points for bird puns! 🐦🎉
Grafana Cloud is the easiest way to get started with metrics, logs, traces, dashboards, and more. We have a generous forever-free tier and plans for every use case. Sign up for free now!


