
Shorten your feedback loop: Java observability with OpenTelemetry, Grafana Cloud, and Digma.ai
Ron Dover is CTO and co-founder of Digma.ai, an IDE plugin for code runtime AI analysis to help accelerate development in complex code bases. Ron is a big believer in evidence-based development and a proponent of continuous feedback in all aspects of software engineering.
Traditionally, software developers have relied on simple logs to understand code execution and troubleshoot issues. Metrics, traces, dashboards, and gauges have predominantly been the domain of IT and infrastructure teams, leaving developers with limited visibility into their application’s performance. This division of responsibilities often meant developers only used observability tools reactively when problems arose.
The landscape is shifting with the advent of modern observability solutions. Tools such as OpenTelemetry have simplified tracing for Java applications, and platforms like Grafana provide a clearer view of application performance, making observability more developer-friendly. Furthermore, specialized tooling like Digma.ai is bridging the gap between dashboards and daily coding workflows, empowering developers to utilize observability proactively throughout the entire development lifecycle.
But how does this work in practice? Observability doesn’t do anyone any good if all it does is aggregate data. So our goal in this blog will be to demonstrate how developers can put observability to practical use by shortening the feedback loop. Specifically, we want to shorten the duration between the time a bug or problem is introduced and the time the developer becomes aware of the problem and its source.
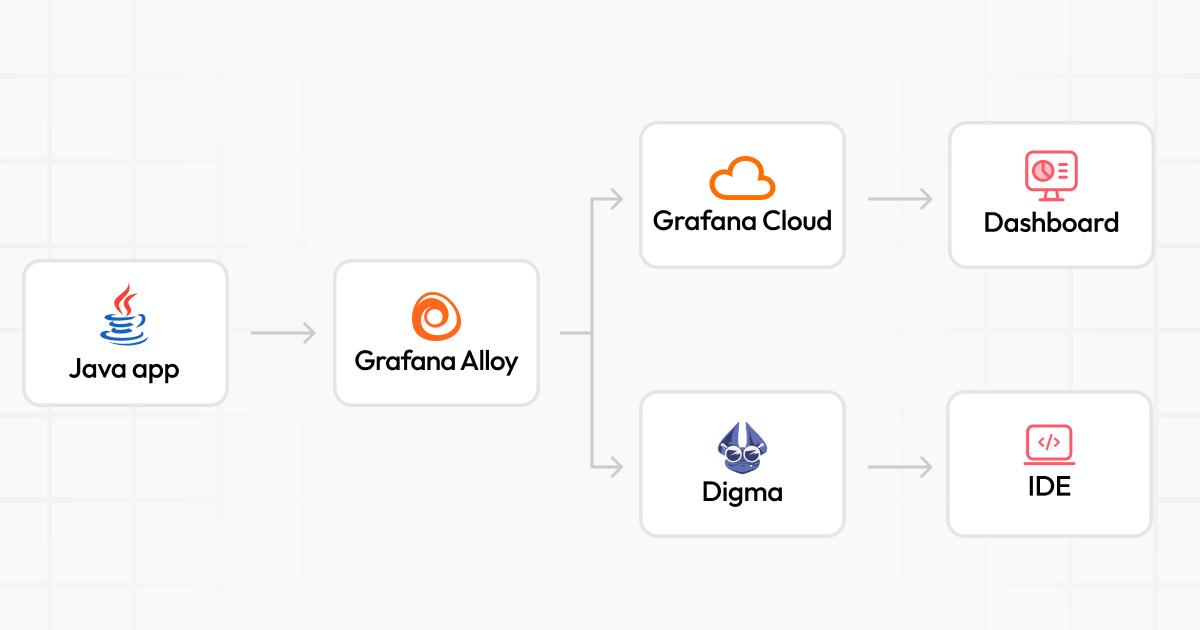
Connecting a Java app to Grafana Cloud and Digma.ai
For our example scenario, we’ll connect a sample Spring Boot application to Grafana Cloud. We’ll also use Digma.ai, a continuous feedback tool that can analyze the app traces right in the IDE. To make this more interesting, we’ll use a new technology called Grafana Alloy, a component-based and easy-to-use open source distribution of OpenTelemetry Collector. Using Alloy is a simple way to configure which data we want to collect and where we want to send it. The complete pipeline will look something like this:

The code for this example is located in this GitHub repo.
How to connect your Java app to Grafana Cloud
You’ll need a Grafana Cloud account to get started. If you don’t have one already, you can sign up for the free tier using this link ( it should take about five seconds).
Once that’s done, there are a bunch of inputs we’ll need to grab to continue our setup and send data to your newly created application observability instance! On your Grafana homepage, click on the Configure button in the OpenTelemetry box:

In the OTel page, we’ll need to copy down a few parameters we’ll need later, as you can see in the screenshot below:

- The OTLP endpoint: We’ll be sending all of the application observability to that destination.
- The Grafana instance ID
- Create an API token, which we’ll use later when connecting to the Grafana Cloud instance.
Copy these values to a safe place; we’ll make use of them later in our setup.
Start and configure the Grafana Alloy container
The Grafana Alloy container will act as our observability “router,” collecting and aggregating our observability data before transmitting it to the Grafana Cloud instance and Digma.
We’ll start by creating an “observability” subfolder under the sample application. We’ll store everything related to configuring our observability pipeline here.
- Create a new file called
config.riverunder the new observability subfolder. This Alloy configuration uses a Terraform-inspired configuration language. Paste in the following text and save the file:
In this file, we define our observability pipeline as code with the following structure:

- OTLP receiver. This component will receive the traces emitted by our Java application.
- OTLP processor. This will be used to optimize our output using a batching strategy to send traces together instead of one by one.
- Exporters. These will send out the traces for storage and processing. We’ll send our traces to two destinations: our Grafana Cloud instance and Digma, which we’ll use to analyze our code.
- Create a new “docker-compose.yaml” file. This file will define the Alloy container and mount our configuration file.
version: "3.6"
services:
 grafana-agent:
   image: grafana/agent:latest
   restart: always
   command:
     - run
     - --server.http.listen-addr=0.0.0.0:12345
     - /etc/agent/config.river
   volumes:
     - ./config.river:/etc/agent/config.river
   ports:
     - "12345:12345"
     - "4317:4317"
   extra_hosts:
     - "host.docker.internal:host-gateway"
   environment:
     - AGENT_MODE=flow
     - OTLP_EXPORTER_DIGMA_COLLECTOR_API=host.docker.internal:5050
     - GRAFANA_CLOUD_OTLP_ENDPOINT=--REPLACE_WITH_GRAFANA_ENDPOINT--
     - GRAFANA_CLOUD_API_TOKEN=${GRAFANA_CLOUD_API_TOKEN}
     - GRAFANA_CLOUD_INSTANCE_ID=--REPLACE_WITH_GRAFNA_INSTANCE_ID--
Replace the values under the “environment” element using the information collected from Grafana Cloud. We’ll want to set the API token as an argument to avoid storing it locally in any file.
Run the Docker Compose file as follows:
cd observability
docker compose up -e GRAFANA_CLOUD_API_TOKEN=--REPLACE_WITH_TOKEN--
Grafana Alloy includes a UI for debugging the state of a pipeline, which is accessible from this URL. From there, we can see the state and configuration of each component of the pipeline, and there’s also a nice graph that shows us the relationship between the different components of the pipeline.

Install the Digma plugin
Now we need to install the Digma plugin to start collecting data from our Java application right away. You can install it from the IntelliJ marketplace in your IDE:

Next, configure the Digma plugin to send our local traces to the Alloy container we created in the previous steps. Go to the Settings page of the IntelliJ IDE and search for “Digma” to bring up the Digma plugin configuration page:

Edit the “Runtime observability backend URL” field and set it to http://localhost:4317. This is the default port used by the Alloy collector.
Run your code and validate that everything works as expected!
With Digma installed, your code will be automatically instrumented.
You can open the Digma observability panel in the IDE to validate that everything is in working order. This panel will always reflect the latest captured observability data.

How to use observability data when developing code
As you work — run, debug, or run tests — the Digma plugin is busy analyzing the observability data, looking for issues, and creating useful usage analytics. It then integrates that data into the IDE. The data will also be tightly integrated into the code itself so you’ll be able to quickly jump between traces and corresponding lines of code.
There are three main areas where you can see that data in play:
The observability panel
We’ve already reviewed this area when we health-checked the data pipeline. Here you’ll be able to quickly jump to see the trace of a recent action or navigate to the relevant endpoint.
The insights panel
This panel is dedicated to a more in-depth analysis of each code location, asset, database query endpoint, etc. It interacts with the code in the IDE and can either take you to the relevant code locations or show the insights (issues and analytics) related to the currently selected code.

Code annotations
With the plugin installed, you’ll be able to see CodeLens overlayed on the code itself indicating runtime usage, dead code, and critical insights:

Bonus: Open the tracing visualization in Grafana Cloud from your IDE
As we saw in the previous section, we can see the tracing visualization inside the IDE. However, we can also connect Digma with Grafana Cloud to open traces directly in your instance.

To enable this behavior:
- Open the Digma settings page.
- Change the “Jaeger link mode” settings for the Digma IntelliJ plugin to external
- Change the “Jaeger URL” setting to point to your Grafana Cloud Tracese page. You can use the following URL template (and replace [Your_Account]):
https://[YOUR_ACCOUNT].grafana.net/explore?left=%7B%22range%22%3A%7B%22from%22%3A%22now-5m%22%2C%22to%22%3A%22now%22%7D%2C%22datasource%22%3A%22grafanacloud-traces%22%2C%22queries%22%3A%5B%7B%22query%22%3A%{TRACE_ID}%22%2C%22queryType%22%3A%22traceql%22%7D%5D%7D
Now, in the Digma Observability view in IntelliJ, If you click on the trace button, you will see the trace visualization in Grafana Cloud Traces.
Code with feedback
Now that everything is up and running, you can start experimenting with the new development practice of continuous feedback (CF), which provides immediate code feedback and analysis. As developers, we notice plenty of useful data we can easily collect about code runtime; however, making that data useful is another matter entirely. That’s why integrating code observability closer to the dev cycle can accelerate code releases and help catch issues much earlier than before. Watch this video to see how CF works.
Ping us on our Slack channel to let us know how your miles vary and what type of feedback you were able to leverage!


