How to use OpenTelemetry resource attributes and Grafana Cloud Application Observability to accelerate root cause analysis
Let’s imagine a scenario: you use OpenTelemetry, and your observability backend runs on several hosts. You collect data on application latency, and notice a recent increase that you want to investigate. But how will you know which host caused the degradation?
This is exactly where OpenTelmetry resources come in.
In the context of OpenTelemetry, a resource represents the entity producing the telemetry data, such as a container, host, process, service, or operating system. When a TraceProvider or MetricProvider is created, a resource will be associated with it and, consequently, all the spans and metrics produced by its Tracer and Meter.
Each resource has its own set of attributes. For example, a host has attributes about its ID, image, name, type, IP, and CPU. With this information, you are able to filter and narrow down which hosts are causing the issue. You can even compare attributes to notice patterns. For example, you might notice a pattern where all hosts of a particular type have better latency, and then can use that information to make changes on the remaining hosts to match those with the better performance.
The information about a resource is collected through OpenTelemetry resource detectors, but not all resource detectors are enabled by default.
Let’s take a closer look at how to collect resource attributes using resource detectors, and how you can derive meaningful insights from those attributes using Grafana Cloud Application Observability.
How to collect resource attributes
Most OpenTelemetry SDKs provide a list of resource detectors that you can use. The most common are host, cloud provider, service, process, process runtime, operating system, container, and Kubernetes. Each language-specific SDK has its own way to set up its resource detectors.
You can check the respective documentation for more details on how to set up for each language and resource detector type:
- Java: AWS, GCP, Providers
- .NET: AWS, Azure, Container, GCP, Host, Process, Runtime
- Node.js: Alibaba, AWS, Azure, Container, GCP, Instana, General
- Go: AWS, GCP
- Python: Azure, Container
- PHP: Azure, Container
Later on this post, we’ll walk through an example of how to set up resource detectors in Node.js.
Committed to upstream OpenTelemetry
We believe there are several resource attributes that can be helpful for users, such as IDs, names and versions for hosts, and services. OpenTelemtry SDKs are being developed incrementally, and different languages can define a different priority in terms of the order in which features are developed. The number of people working on these SDKs also varies, which means some languages are a little further developed than others. This is why our team has been actively working on implementing resource detectors for certain attributes in different language SDKs, so we can get them all to the same place.
Here at Grafana Labs, we really value, and are deeply committed to, the OpenTelemetry project. This means that our work to create or improve resource detectors is being done directly upstream to benefit all users, not just Grafana users.
How to use resource attributes
Now we will walk through an example of how to collect information about host.id and service.instance.id, which are examples of resource attributes that our OpenTelemetry SDK team has worked on. These attributes can now be collected by their own resource detector or as part of cloud provider’s resource detectors on Node.js, Java, .NET, Go, Python, and PHP SDKs:
host.id: Unique host ID. For cloud, this must be theinstance_idassigned by the cloud provider. For non-containerized systems, this should be themachine-id.service.instance.id: The string ID of the service instance in the format of an UUID. It must be unique for each instance of the sameservice.namespace,service.namepair.
Note: This guide is intended for local development or evaluation setups and sends data directly to Grafana Cloud without the OpenTelemetry Collector or Grafana Alloy. A production guide can be found here.
You can also send data to Grafana Cloud or a self-hosted Grafana LGTM Stack (check out this guide) and build your own dashboards with Grafana.
Because OpenTelemetry is vendor-neutral, you can also follow the steps in this blog post for any vendor backend that accepts OpenTelemetry data using the OTLP protocol — just ignore parts that are Grafana-specific.
Ensure that you have the following installed locally: Node.js and npm.
Create a Node.js application
If you already have an application, you can skip this step. This example uses a basic Express application, but you can use any other framework.
- Create an empty
package.jsonin your development directory.
npm init -y- Install Express dependencies.
npm install typescript \
 ts-node \
 @types/node \
 express \
 @types/express

# initialize typescript
npx tsc --init- Create an
app.tsfile.
import express, { Express } from 'express';


const PORT: number = parseInt(process.env.PORT || '8080');
const app: Express = express();


function getRandomNumber(min: number, max: number) {
 return Math.floor(Math.random() * (max - min) + min);
}


app.get('/rolldice', (req, res) => {
 res.send(getRandomNumber(1, 6).toString());
});


app.listen(PORT, () => {
 console.log(`Listening for requests on http://localhost:${PORT}`);
});- Run the application and open http://localhost:8080/rolldice to ensure it is working properly.
$ npx ts-node app.ts
Listening for requests on http://localhost:8080
The following commands install the Node.js API, SDK, and auto-instrumentation tools.
npm install --save @opentelemetry/api
npm install --save @opentelemetry/auto-instrumentations-node
Configure an application
Next, we need to gather authentication environment variables to connect to Grafana.
- Sign into Grafana Cloud (don’t already have a Grafana Cloud account? Sign up for a free one today). The browser will navigate to the Grafana Cloud Portal page: https://grafana.com/profile/org. If the account has access to multiple Grafana Cloud organizations, select an organization from the top left organization dropdown. If the organization has access to multiple Grafana Cloud stacks, navigate to a stack from the left sidebar or the main Stacks list.
- With a stack selected, or in the single stack scenario, below Manage your Grafana Cloud Stack, click Configure in the OpenTelemetry section.

- In the Password/API Token section, click on Generate now to create a new API token:
- Give the API token a name — for example,
test-service. - Click on Create token.
- Click on Close without copying the token.
- Click on Copy to Clipboard to copy the environment variables to the clipboard.

- Pick a Service Name to identify the service — for example,
test.
Now, update the following shell script to configure an application with the information you retrieved above and enable auto-instrumentation.
# Authentication environment variables from steps above
export OTEL_EXPORTER_OTLP_PROTOCOL="http/protobuf"
export OTEL_EXPORTER_OTLP_ENDPOINT="https://..."
export OTEL_EXPORTER_OTLP_HEADERS="Authorization=Basic ..."
export OTEL_SERVICE_NAME=<Service Name>

export OTEL_TRACES_EXPORTER="otlp"
export OTEL_METRICS_EXPORTER="otlp"
export NODE_OPTIONS="--require @opentelemetry/auto-instrumentations-node/register"

# List the resource detectors we want to collect the attributes of
export OTEL_NODE_RESOURCE_DETECTORS="env,host,os,serviceinstance"
If your application uses a cloud provider, add it to the list of detectors on the environment variable OTEL_NODE_RESOURCE_DETECTORS from above.
# Alibaba Cloud
export OTEL_NODE_RESOURCE_DETECTORS="env,host,serviceinstance,alibaba"

# Amazon Web Services
export OTEL_NODE_RESOURCE_DETECTORS="env,host,os,serviceinstance,aws"

# Azure
export OTEL_NODE_RESOURCE_DETECTORS="env,host,os,serviceinstance,azure"

# Google Cloud Platform
export OTEL_NODE_RESOURCE_DETECTORS="env,host,os,serviceinstance,gcp"
Run the application
Now that you have everything setup, you can run your application.
$ npx ts-node app.ts
OpenTelemetry automatic instrumentation started successfully
OpenTelemetry automatic instrumentation started successfully
Listening for requests on http://localhost:8080
Observe the service in Application Observability
Open Application Observability in Grafana Cloud:
- Navigate to a stack with
https://<your-stack-name>.grafana.net. - Expand the top left menu below the Grafana logo.
- Click on Metrics and then New metric exploration.
- You will be able to see different metrics charts.
Identify problematic resources
The metrics page will list all metrics that are currently being sent to your Grafana instance. You can also filter by the metrics you want to focus on, such as latency.

From the list, you can then choose the charts you want to further analyze by clicking Select.
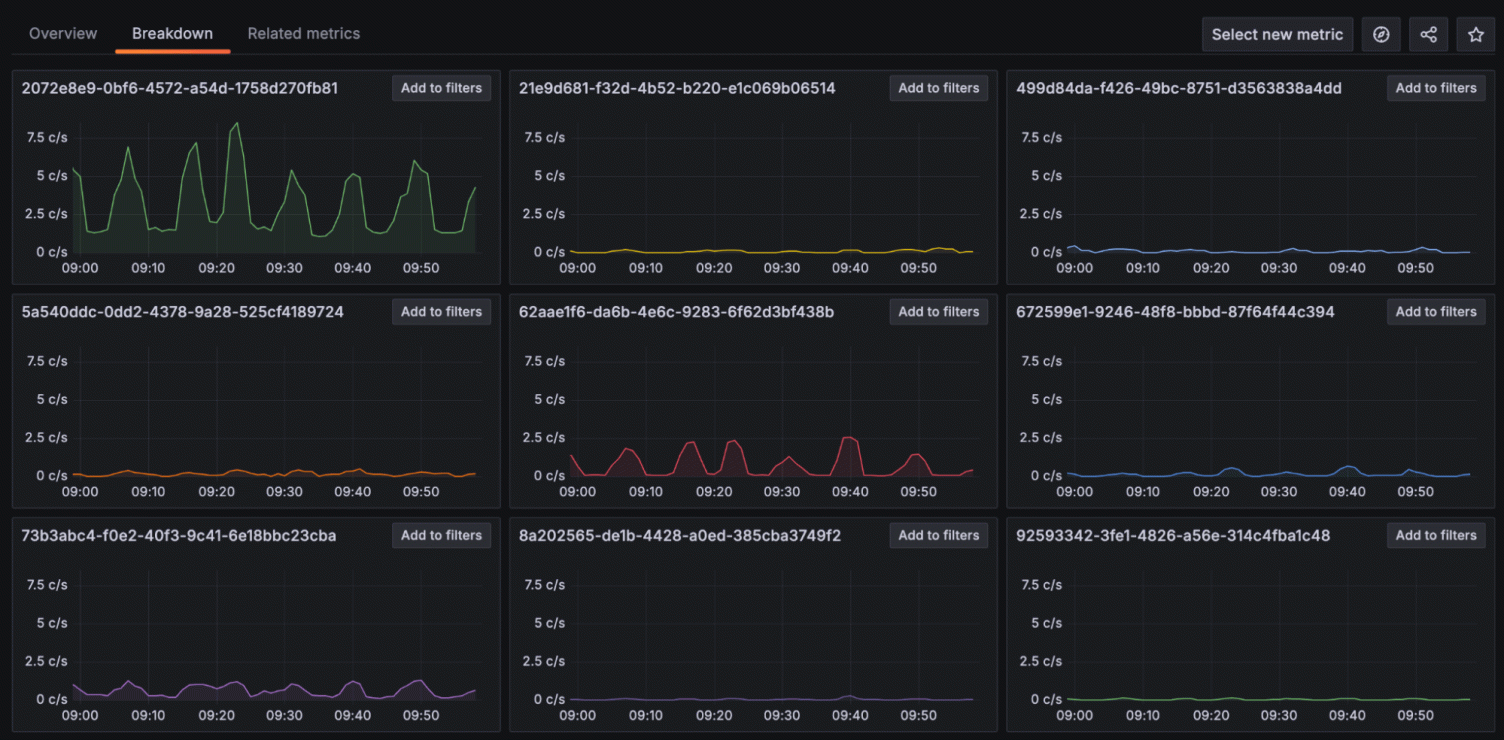
For example, select the chart for traces_spanmetrics_latency_count and it will open a page that lists all possible resources that you can do a breakdown on. By clicking on any of the values, you can see different charts broken down by the different attribute values of the resource you selected. You can also make this selection by clicking on the Breakdown tab, and then on any of the resource names. Here is how it looks when selecting host_id:

In this example, we can see that the first chart has higher values compared to the other ones. If you already know the difference of that host compared to the others, that can help you identify what is causing the higher latency values for that specific resource. This would work similarly if choosing other resources, such as service_instance_id and so on.
Filter traces by resource attribute value
If just knowing the resource attribute you discovered on the previous step is not enough information, you can get more details in the Traces tab. To do that, follow these steps:
- Expand the top left menu below the Grafana logo.
- Click on Application and select the application name you chose.
- Click on the Traces tab.
You will notice it is being filtered by {resource.service.name="test"}.
Select Edit in TraceQL and add any of the resource attributes you collected, for example:
- To see all traces from the same host ID:
{resource.service.name="test" && resource.host.id="5E60C495-B5F9-54CA-B256-30016D15AAE4"} - To see all traces from the same service instance ID:
{resource.service.name="test-service-id-6" && resource.service.instance.id="12098e72-fd23-4927-92d4-65a205014241"}

This will list traces that match the value you selected. To get more details about those traces you can:
- Click on the value of the column Trace ID for the trace you’re interested in. This will open a new area on the right with details about the trace.

- Click on any of the rows within the Service & Operation section and it will open details about that span.

- Click on Resource Attributes or Span Attributes and it will list all values sent with that span.

With the value of the resource attribute in hand, you can make decisions around which values are the best for your application and then adjust parts that are not performing as desired.
Tell us what you think
We’d love to hear about your experiences with Application Observability and OpenTelemetry! Please feel free to reach out on our community Slack by visiting https://slack.grafana.com and joining the #application-observability channel.
Also, for full implementation details and best practices, you can check out our Application Observability documentation.
Grafana Cloud is the easiest way to get started with metrics, logs, traces, and dashboards. We have a generous forever-free tier and plans for every use case. Sign up for free now!