
Monitoring your morning commute with Grafana: the story of a Golden Grot Awards winner
“If you live in Atlanta, the traffic is horrible; it’s very bad. And then if you have a bad day with the weather, it’s even worse.”
You don’t have to live anywhere near Atlanta to relate to the sentiments shared here by Ruben Fernandez. Most of us have experienced the frustrations that come with commuting in or around a metro area, so it’s no surprise that Ruben’s novel approach to staying ahead of his local roadway bottlenecks made him one of the winners of this year’s Golden Grot Awards, our annual awards honoring the very best in personal and professional dashboards.
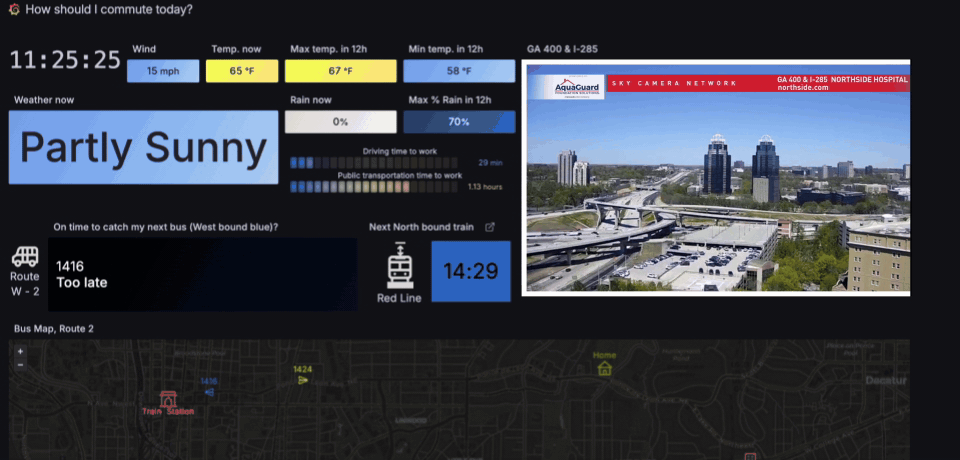
Ruben, who won in the personal dashboard category, built his Grafana dashboard to help him navigate his morning trip to the office, including when to leave and which mode of transportation to take. He used APIs and GTFS real-time feeds to pull in data from weather.gov and the Metropolitan Atlanta Transit Authority, as well as drive-time and traffic information from Google Maps and Bing Maps. He also uses a Prometheus instrumentation library for Python to combine metrics and send them to Grafana Cloud.

Gridlock, bad weather, and a return to the office
Ruben started using Grafana just 18 months ago, as part of his job as an SRE. He was intrigued by last year’s inaugural Golden Grot Awards and began thinking of what he could build for his own personal use that he could also submit for this year’s awards. He looked for public data sources that could potentially support his project, and that’s when he received a bit of inspiration.
Ruben was notified that he needed to return to the office post-pandemic, and he began looking at bus schedules and drive times, which got him thinking about tracking the weather and bundling all that information in one place.
“Traffic could go from maybe 25 minutes to an hour; It could change in that range. So I thought, what do I have to check every morning? How is the weather? How is the traffic? How long is my commute going to be?” Ruben says. “Should I take the train because it’s going to be like one hour in my car? I don’t like that. I prefer the bus, And then on the train I can read. So putting all the information in one spot, I can see what I have to do much easier.”
Ruben continues to find ways to refine his dashboard. He wants to include mobile notifications, and he’s even thinking of incorporating to-go coffee orders and seeing how that would impact his arrival time. In the meantime, he says it’s been great to see how excited his family and his coworkers have been about his win.
“After 30 years of working, I’ve never had anything like this,” Ruben says. “Nobody’s really recognized my work like this, so they’re very happy — my family, my friends, everybody.”
He’s also appreciative of the support for the community, which helped pick the winners from a list of finalists.
“It made me proud,” he says. “When people give you the awards, they are telling you that you did something good, so yeah, I love that.”
What makes a great dashboard?
Ruben’s dashboard wowed the judges with its practicality and ingenuity.
“Picturing someone that looks at their Grafana dashboard before heading to work is very futuristic and fun,” says one judge.
“Ruben is using Grafana for a very useful use case that many people around the world struggle with: efficient daily commuting to work,” says another judge. “Instead of manually looking up information about traffic jams, bus and train transportation schedules, weather, and so on, Ruben has created an amazing dashboard that compiles all of this information and provides a great overview and support in making commuting an easier and more data-driven decision. For anyone who commutes to work daily, I would recommend creating a similar dashboard to simplify this daily decision-making process.”
Ruben thinks his dashboard stood out because of the atypical use case and the incorporation of real-time video feeds. He acknowledges that it was difficult to find the time to learn to build the dashboard and find the data sources, especially as a side project after work and family time. But for those looking to build their own dashboard for personal use, he says the key is to stay undeterred.
“Don’t give up,” Ruben says. “So many times you say, ‘OK, forget about it. I don’t wanna do it.’ But then one day, like me, you have the [inspiration] and something changes and, and you keep up and then you start adding things and you are getting excited and then you go up again. So don’t throw it away because you have some doubts; keep going.”

