How to export any Grafana visualization to a CSV file, Microsoft Excel, or Google Sheets
Grafana dashboards are a great way to combine a lot of technical information into one convenient picture. From time to time, it’s also useful to export data from a particular Grafana visualization to another format, so you can further analyze it and share it with others.
In this blog post, we’ll walk through how to export CSV data for any Grafana visualization you use. This makes it easy to get that data into popular spreadsheet applications, such as Microsoft Excel or Google Sheets. The steps described in this post are universal in three ways:
- They will work for any Grafana visualization, because under the covers, all visualizations are just painting a series of data frames to the screen.
- They will work for any data source (relational or not), because the results of queries get translated into those same data frames.
- They will work while on a Grafana dashboard, or for any Grafana Explore query.
We’ll be using a Sample Website Monitoring Dashboard found on Grafana Play. You can follow along with all of the actions shown in this post using that sample dashboard.

Pick the data you want to export
Let’s start with the server requests data in the dashboard, which is displayed in the time series panel below. Notice that, in the legend, we’re showing stacked lines for four different web servers: 01, 02, 03, and 04.

In the triple-dot menu at the top of the visualization, select Inspect > Data.

On the right, you’ll see a tray slide out. This is a table format version of the data that was displayed in the visualization, with a blue Download CSV button.

If this is all you need, you’re done! But there is much more to this feature; keep reading to learn how it works, how to use it with Grafana Explore, and what else you can do with it.
Select and download a data frame
Getting CSV and tabular data out of a Grafana visualization isn’t as obvious as it looks; the data coming into the plugin from the data source might be in many different formats (such as JSON, rows and columns, or CSV), but when it moves through the rest of the gates toward a visualization, it’s always in data frames. When you export data, you’re exporting Grafana data frames that resulted from some query — you are not exporting data from the underlying data source directly.
With that context, let’s expand the Data options section in the Inspect menu to see what we can do beyond simply exporting to CSV.

If you had a careful eye in the previous step, you probably noticed that the data we exported was only for the first web server — web_server_01 — and not all four frames. In the dialog box above, we can see that Grafana has split the total visualization into four frames, and we could individually export each one of them.
However, if you have a time series with multiple lines on it (as we do in our example here), you usually want all of that data in your spreadsheet, not just one of the lines. To do this, we can choose the Series joined by time option, which exports all the data you see on the visualization.
The four series in our example are four separate data sets, each containing a time and a data point for an individual web server. When we join them by time, we reunite all of the data on the same timeline we saw earlier in the time series chart.
As shown below, there are also options for formatted data and for adding headers that are suitable for CSV processing applications and Excel. I’m going to select Download for Excel to add that header row to my data, and then click Download CSV.

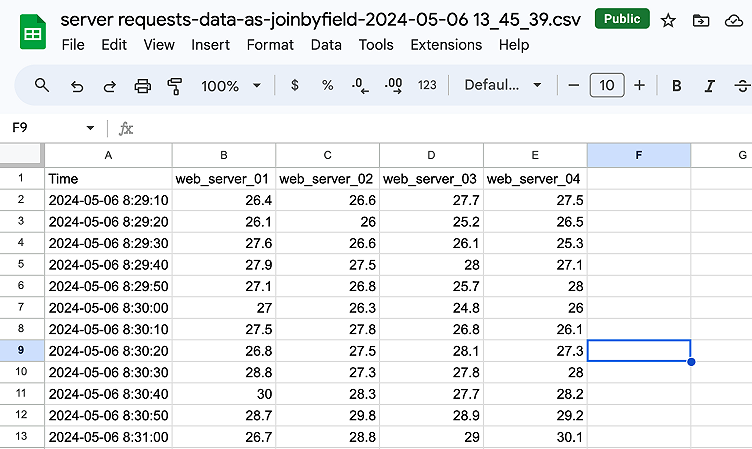
The resulting file download is called server requests-data-as-joinbyfield-2024-05-06 13_45_39.csv, which is convenient, because it tells us exactly what was exported and when. This means, if you do this for many visualizations, you can keep the data separate and remember what was what.
The final step is to import the resulting CSV into Google Sheets, Microsoft Excel, or any other application you use. Because the headers are already present, the data should arrive looking something like this:

Export data from Grafana Explore
If you don’t have a dashboard yet, you might just want to use Grafana Explore to run a query and export data. This is doable as well.
Let’s look at this link to a Prometheus metrics exploration on Play. In the Explore view, we’re doing a very simple PromQL query for aws_ec2_cpuutilization_average.

Here, we’ll hit the Query inspector button to take a look at the details of the query sent to the database.
In the tray that opens up underneath, the tab on the right labeled Data will show all of the same options we saw when exporting data from a panel visualization. Everything said above applies in the same way here: the selection of data frames, the header row, and how to export.

Wrapping up
Grafana works with your data internally as a series of data frames, no matter where that data came from or how it was originally stored and queried. This means that exporting data is fairly simple; we just convert those data frames into a CSV file, which you can use with any spreadsheet application, or any other software.
For more information on how all of the pieces of a Grafana dashboard work together, check out our dashboard overview. And if you have any further questions on this topic, feel free to ask a question on the Grafana Community Site!
Grafana Cloud is the easiest way to get started with dashboards, metrics, logs, traces, and more. We have a generous forever-free tier and plans for every use case. Sign up for free now!


