
Serverless observability: How to monitor Google Cloud Run with OpenTelemetry and Grafana Cloud
OpenTelemetry has emerged as the go-to open source solution for collecting telemetry data, including traces, metrics, and logs. What’s especially unique about the project is its focus on breaking free from the reliance on proprietary code to offer users greater control and flexibility.
As a senior solutions engineer here at Grafana Labs, I’ve spent a lot of time exploring OpenTelemetry, including in my spare time. As a follow-up to my previous blog post about getting AWS Lambda traces with OpenTelemetry, I became curious about applying OTel to other serverless solutions.
Serverless platforms offer a number of benefits. They allow you to pay only for the resources you use, and they automatically scale with workload demands. In addition, serverless models eliminate the need to manage any underlying infrastructure, which means developers have more time to focus on application development and deployment.
Because of their transient nature, however, serverless solutions can sometimes be a challenge when it comes to observability. Serverless jobs are designed to be short-lived, meaning the telemetry data generated within these instances must be promptly exported. This is where OpenTelemetry comes in, offering a push-based approach to ingest telemetry data using the OpenTelemetry Protocol (OTLP).
In this post, I’ll demonstrate how to use OpenTelementry to collect telemetry data for Google Cloud Run, a serverless solution in Google Cloud Platform (GCP). We’ll explore how to use auto-instrumentation for OpenTelemetry with a Node.js application to efficiently export telemetry data from the Cloud Run service and analyze it using Application Observability in Grafana Cloud.
Note: You can find the full source code used in this blog on GitHub.
First, some background
Google Cloud Run is a fully managed container runtime that automatically scales your code in a container, from zero to as many instances needed to handle incoming requests.
Google recently updated its Cloud Run architecture, introducing the concept of multi-containers, or sidecars. Previously, a Cloud Run service could only run one container. Now, a sidecar container can be initiated alongside the main (ingress) container. According to Google, this change is intended to address various use cases, including:
- Running application monitoring, logging, and tracing (and, really, enabling observability in general)
- Using Nginx, Envoy or Apache2 as a proxy in front of your application container
- Adding authentication and authorization filters
- Running outbound connection proxies
With the sidecar container, we can deploy the OTel Collector and capture the telemetry data generated by the Cloud Run service.
Being able to gather telemetry data is just one piece of the puzzle; we also need a backend where we can store that data and derive insights from it. This is where Grafana Cloud Application Observability comes into play.
Application Observability is an out-of-the-box observability solution designed to minimize the mean time to repair (MTTR) for modern applications (like serverless) using OpenTelemetry semantic conventions and the Prometheus data-model.
Application Observability helps users with:
- Data collection: Rely on open standards and lock-in free instrumentation with OpenTelemetry to collect metrics, traces, and logs.
- Visualization: Take advantage of pre-built dashboards and workflows, including the Service Inventory, Service Overview, and Service Map, for easier exploration of metrics, logs, and traces.
- Anomaly detection: Use pre-configured dashboards to detect anomalies in your services and applications.
Prepare the Node.js application
The beauty of auto-instrumentation lies in its ability to instrument any application (check the language’s auto-instrumentation support) and capture telemetry data from various libraries and frameworks without requiring any code changes.
The Node.js application we use for this blog is based on the OpenTelemetry Node.js Getting Started example with a few modifications. It consists of two services: Service A and Service B. Service A directs requests to Service B, operating on port 8080. Service B responds to requests on port 5050 with a simple message: “GRAFANA APPLICATION O11Y IS AWESOME !!!”. This configuration aims to showcase the communication between the two services and how OTel captures this interaction.

Set up the Cloud Run service
There are plenty of resources detailing the prerequisites and steps required to set up Cloud Run. For the purposes of this blog, I’ll assume you’ve already completed these, but if not, you can follow the steps outlined in this tutorial.
As Cloud Run operates on containers, we’ll need to create an Artifact Registry Docker repository to host our application service images.
Let’s create our otel-grafana-o11y repo inside our blog-otel-grafana-o11y project in the europe-west9 region (though, you can choose the region of your choice). First, make sure to enable the Artifact Registry API.

Then, from the console, run the following command.
gcloud config set project blog-grafana-o11y-otel
gcloud config set run/region europe-west9

gcloud artifacts repositories create grafana-o11y-otel \
    --repository-format=docker \
    --location=europe-west9 \
    --project=blog-grafana-o11y-otel
Here is the output from the GCP console.

Configure auto-instrumentation for our Node.js services
Now that the Cloud Run service is configured, it’s time to focus on our Node.js application. Let’s examine the code of our two services.
1. Service A
const express = require("express"); // Import the Express framework
const app = express(); // Create an Express application instance
const axios = require("axios"); // Import the axios library for making HTTP requests

// Define a route for handling GET requests to the root URL ('/')
app.get("/", async (req, res) => {
	// Send a GET request to Service B
	let response = await axios.get("http://localhost:5050");

	// Send a response to the client, combining the response data from Service B with a custom message
	res.send("Service B says: " + response.data);
});

// Define the port to listen on, using the value of the PORT environment variable if it's set, otherwise default to port 8080
const port = parseInt(process.env.PORT) || 8080;

// Start the Express server and make it listen on the specified port
app.listen(port, () => {
	console.log(`Service A listening on port ${port}`); // Log a message to indicate that the server is running
});
2. Service B
const express = require("express"); // Import the Express framework
const app = express(); // Create an Express application instance

// Define a route for handling GET requests to the root URL ('/')
app.get("/", async (req, res) => {
	res.send("GRAFANA APPLICATION O11 IS AWESOME !!!!"); // Send a response with the message "GRAFANA APPLICATION O11 IS AWESOME"
});

// Define the port to listen on, using the value of the PORT environment variable if it's set, otherwise default to port 5050
const port = parseInt(process.env.PORT || 5050);

// Start the Express server and make it listen on the specified port
app.listen(port, () => {
	console.log(`Service B listening on port ${port}`); // Log a message to indicate that the server is running
});
Now, let’s configure the automatic instrumentation with Node.js according to the OpenTelemetry JavaScript documentation and the @open-telemetry/auto-instrumentions-node documentation using npm.
npm install --save @opentelemetry/api
npm install --save @opentelemetry/auto-instrumentations-node
To run the Node.js application with auto-instrumentation, run the following command.
node --require @opentelemetry/auto-instrumentations-node/register serviceA.js
For our two services, we need to create a package.json file containing all the necessary dependencies and commands to run. This JSON package will then be used during the Docker image building process.
Here is an example of the package.json file for Service A where we specify the express and axios libraries, as well as the OpenTelemetry auto-instrumentation libraries.
{
  "name": "ServiceA",
  "version": "1.0.0",
  "description": "serviceA running in Cloud Run",
  "main": "index.js",
  "scripts": {
    "start": "node --require @opentelemetry/auto-instrumentations-node/register  serviceA.js"
  },
  "dependencies": {
    "@opentelemetry/api": "^1.8.0",
    "@opentelemetry/auto-instrumentations-node": "^0.43.0",
    "axios": "^1.6.2",
    "express": "^4.18.2"
  }
}
Now, let’s create our Dockerfile for Service A.
FROM node:20.12.0-slim
WORKDIR /usr/src/app
COPY package*.json ./
RUN npm install

# Copy local code to the container image.
COPY . .

# Run the web service on container startup.
ENV PORT=8080
CMD [ "npm", "start" ]
…and push it to our Artifact registry.
gcloud builds submit --tag europe-west9-docker.pkg.dev/blog-grafana-o11y-otel/grafana-o11y-otel/servicea:latest
Repeat the same process for Service B.
You can see from the Cloud UI that our Service A and Service B containers have been successfully pushed.

Configure the OpenTelemetry Collector to connect to Application Observability
Grafana Cloud Application Observability is compatible with the OpenTelemetry Collector and accepts OTLP natively. To set up the OpenTelemetry Collector as the data collector to send to Grafana Cloud:
- Create and/or login to a Grafana Cloud account. If you don’t already have a Grafana Cloud account, you can create a free Grafana Cloud account today.
Note: There are two distributions of the OpenTelemetry Collector: core and contrib. Application Observability requires the contrib distribution.
1. Create the OTel Collector configuration file
A config.yaml configuration file is needed for the OpenTelemetry Collector to run. The good news is that Application Observability includes a guided configuration menu that will help you generate the OTel Collector configuration. To get this configuration, follow the Add service → OpenTelemetry Collector from the list.

The OpenTelemetry Collector integration will generate an OpenTelemetry Collector configuration to use with Grafana Cloud Application Observability.
To ensure the collector works seamlessly with the Cloud Run service, we can include a health_check option in the extension section. (Refer to the “Deploy the Cloud Run service” section below for more details.)
extensions:
  health_check:
...
service:
  extensions: [health_check,basicauth/grafana_cloud_tempo, basicauth/grafana_cloud_prometheus, basicauth/grafana_cloud_loki]
You can find the complete configuration file in the GitHub repository. You can also refer to the Grafana Cloud documentation for more information.
2. Create the OTel Collector Dockerfile
Here is the Dockerfile configuration that bundles the previous OTel Collector configuration into the contrib collector image:
FROM otel/opentelemetry-collector-contrib:0.94.0
COPY collector-config.yaml /etc/otelcol-contrib/config.yaml
3. Push the OTel Collector
gcloud builds submit --tag europe-west9-docker.pkg.dev/blog-grafana-o11y-otel/grafana-o11y-otel/otelcollector:latest
Deploy the Cloud Run service
Currently, we have all three containers stored in our Artifact Registry. Now, we can deploy our Google Cloud Run service. I opted for the YAML method to configure my Cloud Run service with Knative.
Before we move on, there’s one important thing to mention: the OTel Collector uses a push-based approach, so when the application sends telemetry data, it expects that the OTel Collector is ready to receive and export it. This means OTel Collector has to start up before the application does, and it needs to stop after the application shuts down.
Luckily, Google has added a useful feature to Cloud Run sidecars: container dependency. This allows us to control the order in which containers start and stop. We can make sure the OTel Collector starts before Service A and Service B, and stops after them. This is really important so that we don’t miss any of the data we’re supposed to collect. We also need to use the startup healthcheck probe to have a successful deployment.
Additionally, as specified in the OTEL documentation, we will use environment variables and pass in the configuration values in each container section. Note: currently, only Traces are supported for environment variable configuration.
For instance, we will use the following environment variables.
Environment variable | ServiceA container | ServiceB container |
OTEL_SERVICE_NAME | ServiceA | ServiceB |
OTEL_LOG_LEVEL | info | info |
OTEL_EXPORTER_OTLP_PROTOCOL | http/protobuf | http/protobuf |
Let’s review the service.yaml file,where we set the container start order and indicate the health check probe.
apiVersion: serving.knative.dev/v1
kind: Service
metadata:
  annotations:
    run.googleapis.com/launch-stage: BETA
  name: grafana-o11y-otel
  labels:
    cloud.googleapis.com/location: "europe-west9"
spec:
  template:
    metadata:
      annotations:
#The following line aims to set a container start order
        run.googleapis.com/container-dependencies: '{"servicea":["otelcollector"],  "serviceb":["otelcollector"]}'
    spec:
      containers:
        - image: "europe-west9-docker.pkg.dev/blog-grafana-o11y-otel/grafana-o11y-otel/servicea:latest"
          name: servicea
          env:
            - name: OTEL_SERVICE_NAME
              value: "ServiceA"
            - name: OTEL_PROPAGATORS
              value: "tracecontext"
            - name: OTEL_LOG_LEVEL
              value: "info"
            - name: OTEL_EXPORTER_OTLP_PROTOCOL
              value: "http/protobuf"
          ports:
            - containerPort: 8080
        - image: "europe-west9-docker.pkg.dev/blog-grafana-o11y-otel/grafana-o11y-otel/serviceb:latest"
          name: serviceb
          env:
            - name: PORT
              value: "5050"
            - name: OTEL_SERVICE_NAME
              value: "ServiceB"
            - name: OTEL_PROPAGATORS
              value: "tracecontext"
            - name: OTEL_LOG_LEVEL
              value: "info"
            - name: OTEL_EXPORTER_OTLP_PROTOCOL
              value: "http/protobuf"
#The following lines define the health-check probe configuration
        - image: "europe-west9-docker.pkg.dev/blog-grafana-o11y-otel/grafana-o11y-otel/otelcollector:latest"
          name: otelcollector
          startupProbe:
            httpGet:
              path: /
              port: 13133
          resources:
            limits:
              cpu: 1000m
              memory: 512Mi
Let’s deploy our Cloud Run service.
gcloud run services replace service.yaml
We should have the following input, where URL is the URL to call.
Applying new configuration to Cloud Run service [grafana-o11y-otel] in project [blog-grafana-o11y-otel] region [europe-west9]
✓ Deploying... Done.
  ✓ Creating Revision...
  ✓ Routing traffic...
Done.
New configuration has been applied to service [grafana-o11y-otel].
URL: https://grafana-o11y-otel-xscqzsykua-od.a.run.app
Once deployed, you can get and save the service URL by running the following command, where $SERVICE_NAME is the name of the service in the YAML file (grafana-o11y-otel) and $REGION is the region we set earlier (europe-west9):
gcloud run services describe $SERVICE_NAME --platform managed --region $REGION --format 'value(status.url)'
Using the Cloud Run console, we can confirm that our Cloud Run service has been deployed successfully, along with all three containers. Additionally, we can observe that the environment variables have been updated.

You can now issue a few requests to generate trace data. Let’s use a loop to issue a request every five seconds (don’t forget to stop the script when finished):
while true; do curl "https://grafana-o11y-otel-xscqzsykua-od.a.run.app"; sleep 5; done;
Analyze data with Grafana Cloud Application Observability
Now that everything is working as expected, let’s open Application Observability in Grafana Cloud:
- Navigate to a stack: https://<your-stack-name.>grafana.net
- Expand the top left menu below the Grafana logo
- Click on Application
Application Observability relies on metrics generated from traces being ingested into Grafana Cloud. Those metrics are used to display the Rate Error Duration (RED) method information in Application Observability.

To complete the setup, click Enable Application Observability.
Note: It might take up to five minutes to generate metrics and show graphs.
The Service Inventory page lists all the services that are sending distributed traces to Grafana Cloud. You can see that we are able to capture both Service A and Service B.

We can also check the Service Map page to get a graph of related services and health metrics at a high level.
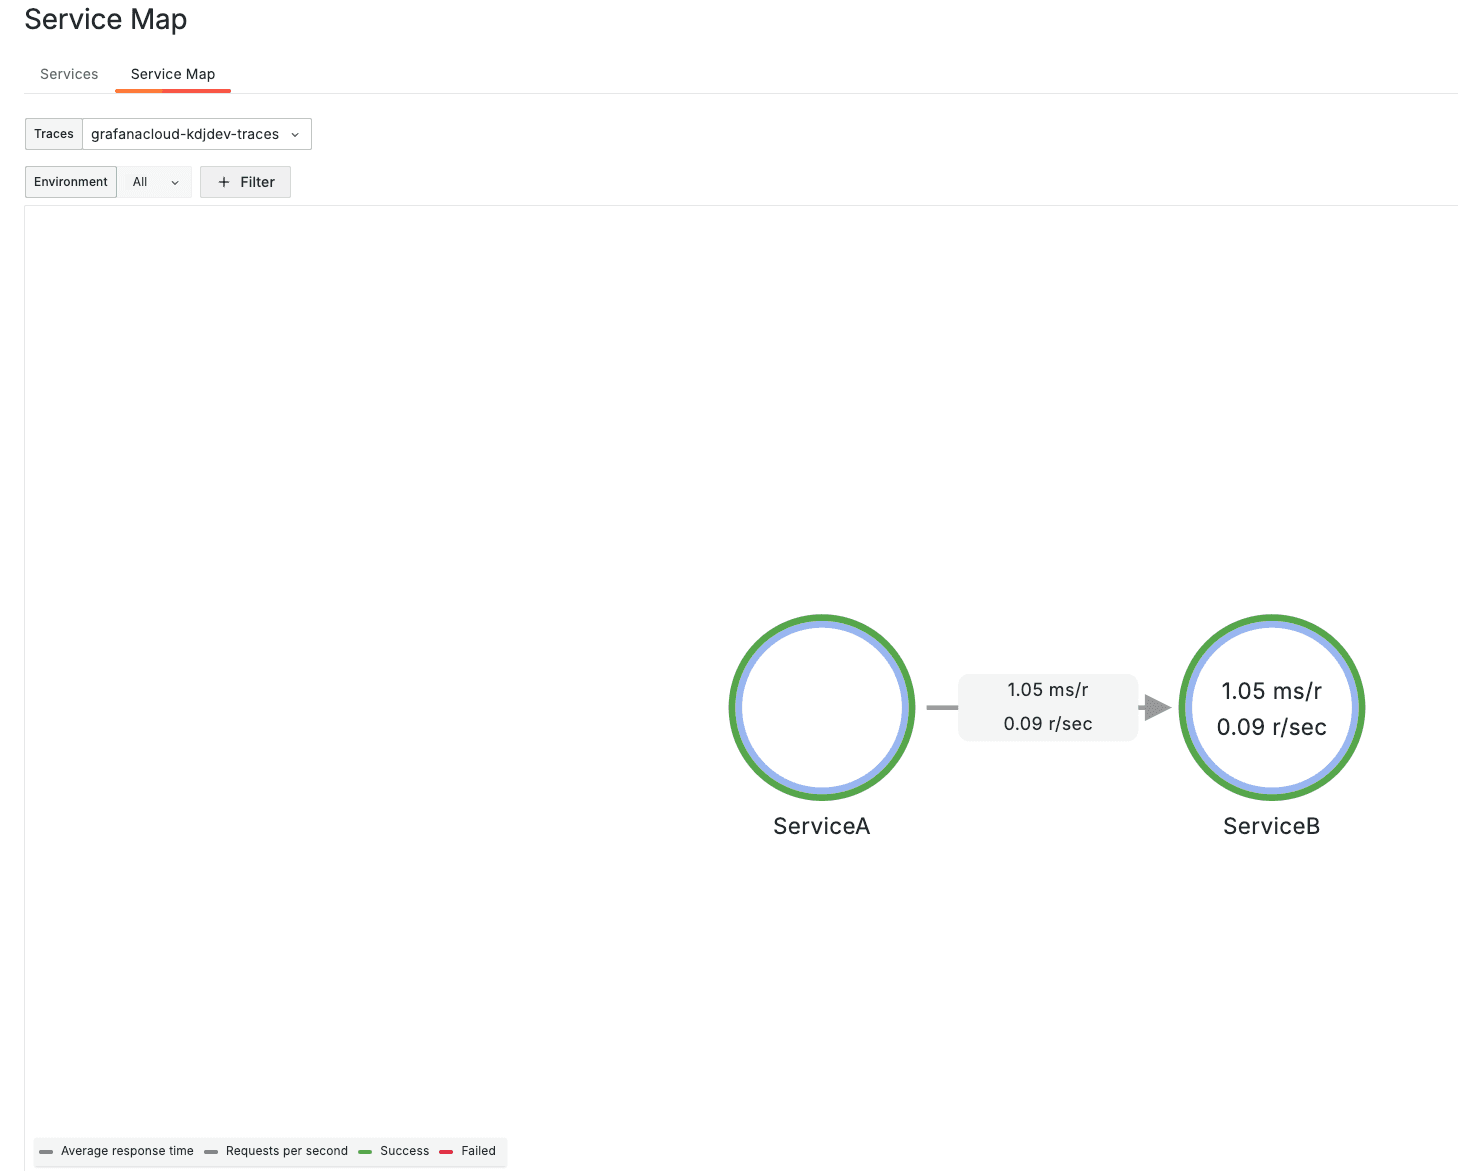
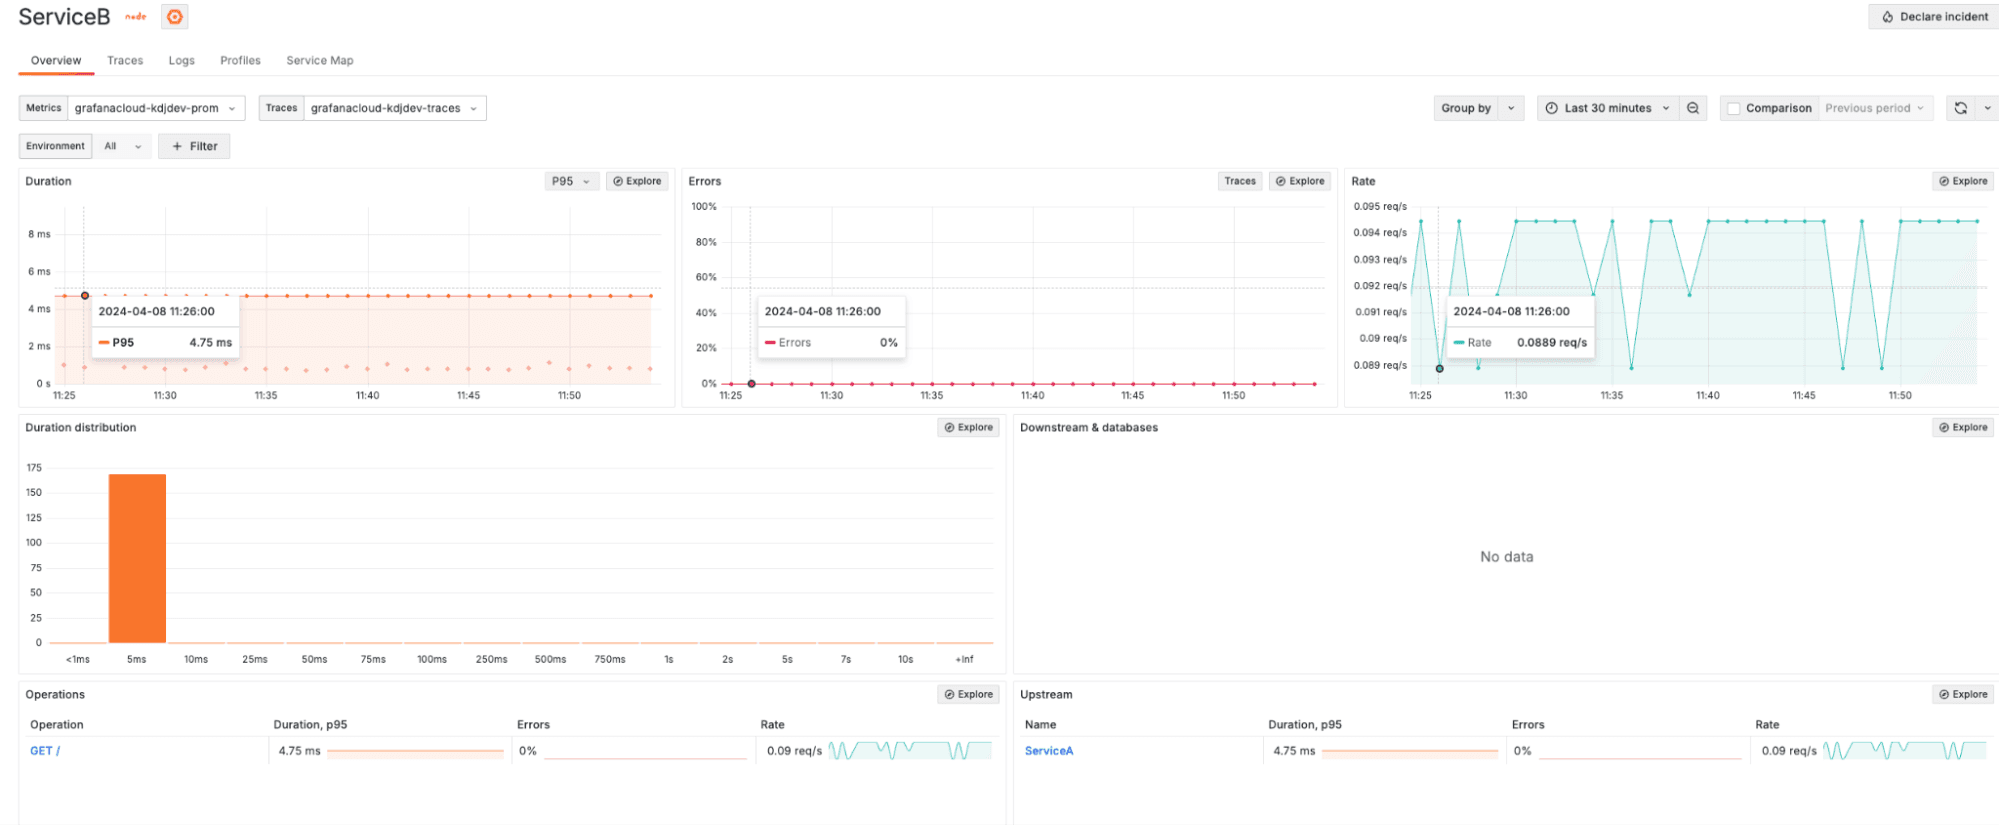
Let’s navigate to the Service Overview page for each of our services (Service A and Service B). This page provides a health overview with RED metrics for:
- The service itself
- Related upstream and downstream services
- Operations performed on the service
Here’s the Service Overview page for Service A:

And here’s the same page for Service B:
The Traces view provides a view of all the traces related to our services. By default, Application Observability filters traces by the service and service namespace. There are two ways to customize search queries:
- TraceQL to use the Trace query language
- Click Search to use the visual TraceQL query builder
Here’s the Traces view for Service A:
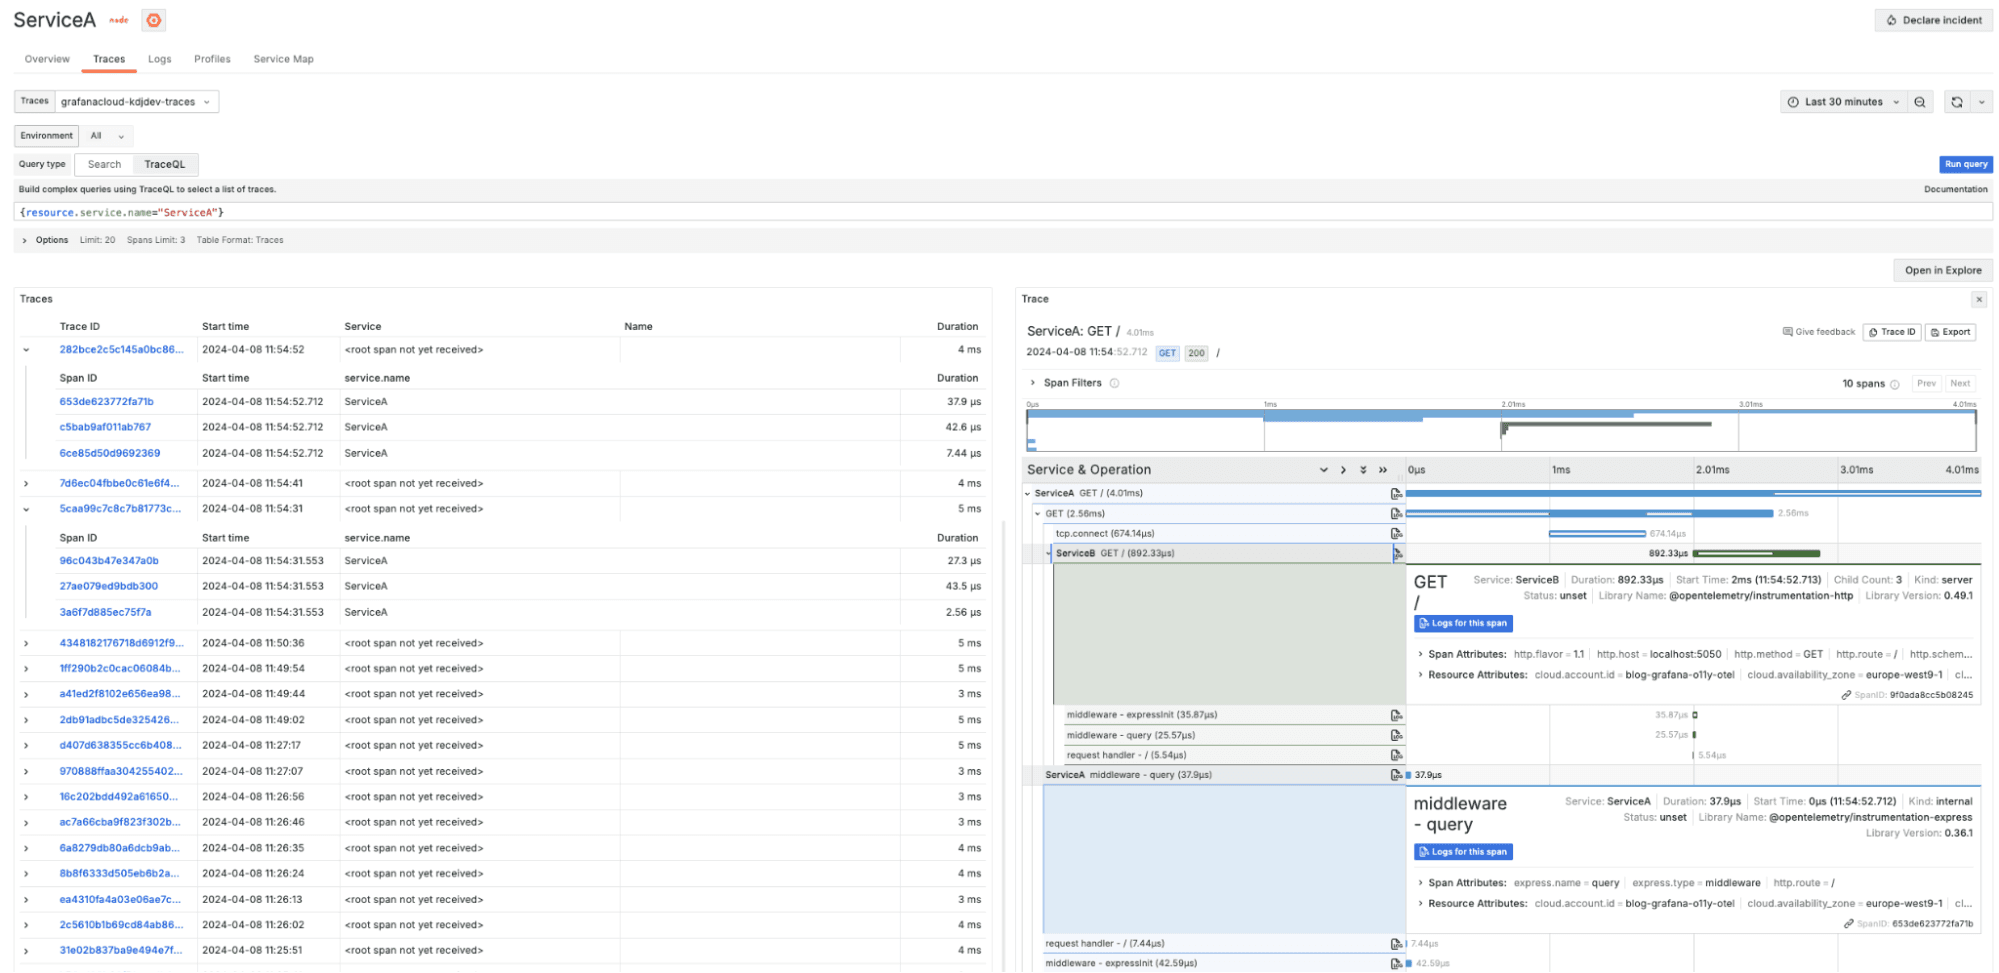
And here’s the Traces view for Service B:

Let us know what you think!
In summary, OpenTelemetry makes it pretty simple to automatically instrument Node.js applications. This involves installing necessary Node.js packages for auto-instrumentation and setting up the OTel Collector to gather telemetry data and send it to Grafana Cloud.
By combining the power of OpenTelemetry for data collection and Grafana Cloud Application Observability for visualization and analysis, organizations can achieve comprehensive observability. This empowers teams to proactively identify and address issues, as well as optimize the performance and reliability of their — even in serverless environments, where visibility can be a challenge.
We’re committed to continuous improvement, and your feedback is invaluable in this journey. If you’ve used OTel and Grafana Cloud for serverless observability, please share your thoughts and experiences with us. You can find our team in the Grafana Labs Community Slack in the #opentelemetry channel.
Grafana Cloud is the easiest way to get started with metrics, logs, traces, and dashboards. We recently added new features to our generous forever-free tier, including access to all Enterprise plugins for three users. Plus there are plans for every use case. Sign up for a free account today!

