
How to visualize Amazon CloudWatch metrics in Grafana
In the wide world of observability, you have many options for visualizing metrics collected by Amazon CloudWatch. And because of that, you’re often left making lots of decisions — about cost, configurations, flexibility, and more. At Grafana Labs, we stick to our “big tent” philosophy, which means we don’t force you into a decision or even tell you that you have to bring your CloudWatch metrics to Grafana Cloud.
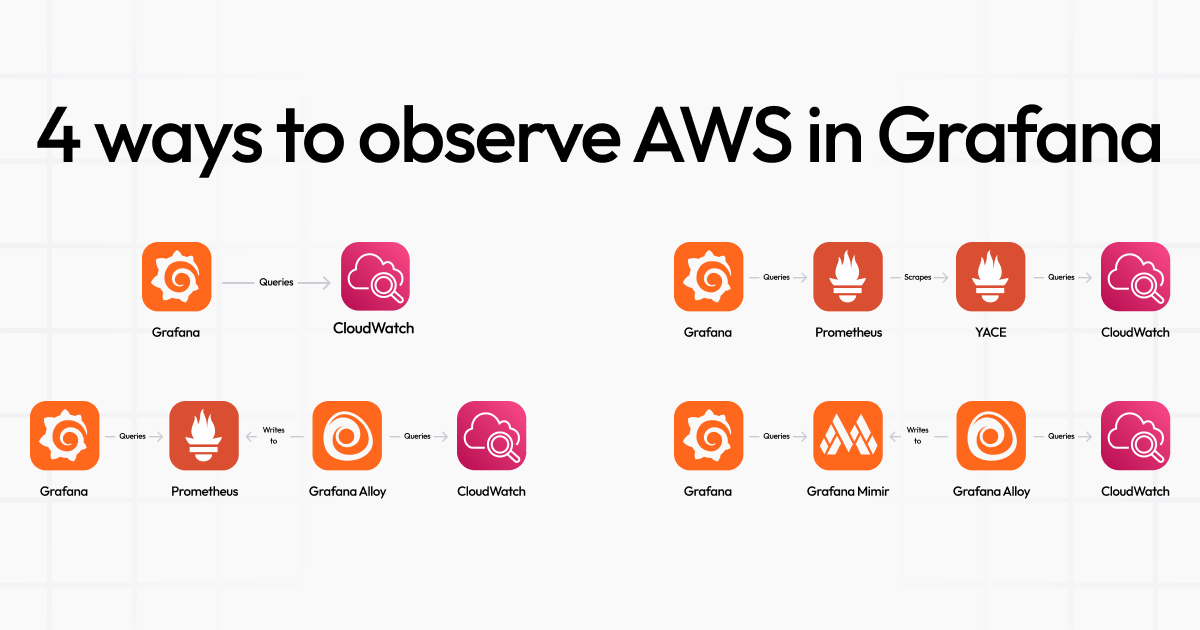
This flexibility is great, but it often leaves our users wondering which option is right for them. That’s why we wrote this blog post to help you understand the four primary options for visualizing AWS metrics in Grafana:
- Grafana Labs Amazon CloudWatch data source
- AWS Observability CloudWatch metrics with the AWS Observability app
- Running Grafana Alloy with the CloudWatch exporter
- Running the yet-another-cloudwatch-exporter (YACE), an open source Prometheus exporter for CloudWatch
Visualizing the different deployment models
Before we dive into the comparisons let’s take a look at a standard deployment of each option so you can get a good visual idea of what each one does.


Note: if you’re interested in how Grafana Labs operates Alloy as a part of the AWS Observability app, keep an eye out in the next few weeks for an upcoming blog post that will cover this in depth.


Which approach is right for you?
For the rest of this piece, we’ll focus on the similarities and differences between the various approaches. The exact fit will depend on the needs of your system and your team, and there are a number of considerations to factor in. But before we get into all of that, we wanted to call out the fact that the easiest way to start observing your AWS environment is with Grafana Cloud. Here’s a TL;DR decision tree* that should help point you in the right direction:

*You can use the YACE model in Grafana Cloud, but it is not recommended as we will not be able to offer support through our standard support ticket process.
How are they all the same?
All the options outlined here use Amazon CloudWatch APIs (ListMetrics and GetMetricData) to make the data available in Grafana. This is a good thing because it ensures all options are capable of producing the same data. (You should also be mindful that calling these APIs will incur a cost on your AWS account.)
In addition, each option also offers support for a wide array of CloudWatch namespaces, including support for custom metrics via custom namespaces.
And here’s something that you might not know: With the exception of the Amazon CloudWatch data source, all of the options listed here are actually just YACE in different wrappers! We take the idea that “open source is in our DNA” very seriously, so all the work we have done and continue to do to improve our CloudWatch metrics solutions has made its way into YACE. This has amounted to more than 200 PRs from Grafana Labs employees and major features like:
- An improved algorithm for matching resources to CloudWatch metrics
- AWS SDK v2 support
- AWS DDoS protection support and other CloudWatch namespaces
- Numerous performance enhancements, bug fixes, and code quality improvements
How are they different?
Despite the similarities, there are some notable differences, which we’ll break down here into three main areas: storage, fidelity, and operational complexity.
Where the data is stored
The first key difference is that the Amazon CloudWatch data source leaves the data in AWS and gives you direct query access to it. This is an incredibly cost efficient solution to enable visualization of CloudWatch data in Grafana. You pay based on how often you query the data. And since it attempts to mirror many CloudWatch features, you gain access to advanced functionality like metric math and Metrics Insight queries.
The YACE-based options (AWS Observability App and Grafana Alloy CloudWatch exporter) all extract the data from CloudWatch, transform it to a Prometheus-compatible format, and make it available in a centralized data store. This approach focuses on mirroring raw data from CloudWatch and does not allow for advanced features like metric math or Metrics Insights queries.
Of course, this begs the question: Why pay to pull this data out of CloudWatch and store it elsewhere? Well, a huge selling point for this model is that it enables you to build cross-account, cross-region, and cross-service dashboards, alerts, and queries leveraging the power of PromQL. Let’s look at what a query would look like to find CPU utilization for two accounts and two regions and how that compares using PromQL vs. the Amazon CloudWatch data source.
First, let’s look at how you’d use the Amazon CloudWatch data source to query the data in CloudWatch. As you can see from the screenshot below of Explore mode in Grafana, you have to set up one Amazon CloudWatch data source per account, and you can only query one region at a time using the manual builder.

Alternatively, with PromQL, you just need to run this one very basic query with filters:
aws_ec2_cpuutilization_maximum{account_id=~"974410390816|account2", region=~"us-east-1|us-east-2"}Data fidelity
Amazon CloudWatch data source only interacts with AWS’s CloudWatch API, and as such, it can only give you raw CloudWatch metrics and statistics within the dimensions available in CloudWatch. This often isn’t enough information on its own to make actionable decisions unless you know your EC2 instance ID by heart. (I know I don’t!)
Given this hard-to-fill gap in CloudWatch, the YACE-based options include an extra feature known as “Resource Tag Association.” This feature goes the extra step of calling AWS Resource Tagging APIs and associating those tags to CloudWatch metrics. The ability to query your tag data with CloudWatch metrics makes it so much easier to have actionable data when things go wrong. Let’s look at what our CPU utilization query would look like with tags:
aws_ec2_cpuutilization_maximum{account_id=~"974410390816|account2", region=~"us-east-1|us-east-2"} + on (name) group_left(tag_Application, tag_Name) aws_ec2_info
Notice that this leverages PromQL’s group_left, which is a little more advanced. But don’t worry if you aren’t a Prometheus expert: We have you covered in the AWS Observability app, where you can observe all your EC2 and RDS resources with tags — no querying needed. Check out the examples on play.grafana.com:
If you want to avoid group_left altogether, the YACE-based options (AWS Observability App and Grafana Alloy CloudWatch exporter) have a feature available that allows you to add your tags onto your CloudWatch metrics, transforming your query back to the original:
aws_ec2_cpuutilization_maximum{account_id=~"974410390816|account2", region=~"us-east-1|us-east-2"}Feel free to experiment with both query versions in Explore on play.grafana.com
Operational complexity
There are two “we can run it for you” options: Amazon CloudWatch data source and the AWS Observability App. But if you want to have more control over your metric experience, you always have the option to run Grafana Alloy or even YACE. By running it yourself, you can control your scrape intervals more tightly and you get more advanced YACE configuration like dimension filters.
There are many more details to consider, but the ones shared so far are the biggest differentiators. As a means to help you digest all of this and give you another quick reference, here’s a comprehensive feature comparison grid to help go along with the decision tree introduced earlier. These should help guide you through all your CloudWatch metrics decisions.

The tent will only get bigger
If you’re familiar with CloudWatch, you might know that pulling the data is not the only option you have for data delivery. CloudWatch also offers metric streaming through Amazon Data Firehose, and in case you didn’t know, we recently used that functionality to help launch Logs with Firehose support for the AWS Observability app.
And we have more in the works. Our roadmap includes metric streaming support with Grafana Alloy and an agent-less AWS Observability app experience. We also plan to dive into the world of CloudWatch for OpenTelemetry, to see what we can do to bring the improvements we’ve made to our favorite OSS Prometheus exporter (YACE) to OTel users as well.
Grafana Cloud is the easiest way to get started with metrics, logs, traces, dashboards, and more. We have a generous forever-free tier and plans for every use case. Sign up for free now!


