Logs with Firehose: Stream logs to the AWS Observability app cheaper and easier
AWS is an essential part of many organizations’ tech stacks today, which is why we continue to make it easier to observe your environment in Grafana Cloud. We recently launched AWS Observability, a fully managed application for visualizing and alerting on dozens of AWS offerings. And with our latest update, we’re making it cheaper and simpler to ingest and query your AWS logs.
Logs with Firehose is now generally available, enabling AWS users to stream their logs to Grafana Cloud through Amazon Data Firehose, a managed service for real-time streaming of data to other AWS services, custom HTTP endpoints, or HTTP endpoints owned by third-party providers like Grafana Labs. In this blog, we’ll explain how this new feature works and how it differs from existing techniques for collecting CloudWatch logs in Grafana Cloud.
How it all works
This solution makes it easy to connect Amazon CloudWatch logs to Grafana Cloud because you don’t have to deploy agents or local configurations. Instead, a Firehose stream is configured on your AWS infrastructure.
Delivery streams are configured to batch and send ingested records to Grafana Cloud Logs, which is powered by Grafana Loki, our open source log aggregation system. You can use the Firehose delivery stream to send logs from multiple AWS offerings, including Amazon CloudWatch (through subscription filters), VPC Flow Logs, AWS CloudTrail, and more.
To prevent potential data loss, you can also back up events to an Amazon S3 bucket. You can configure this for all log events or just for those that failed to get delivered—for example, if the delivery quota is exceeded. For more information about adjusting your backup based on the amount of log data you’re streaming, see the AWS documentation on data delivery failure handling.

How to get started
To configure Logs with Firehose, you’ll need to:
- Create an access policy and authentication token in Grafana Cloud
- Connect your Firehose delivery stream to Grafana Cloud
- Run a query to verify that AWS is sending logs to your Grafana instance
For detailed instructions on how to get started, refer to our configuration documentation.
A bigger tent: two ways to send AWS logs to Grafana Cloud
Historically, Logs with Lambda (also known as lambda-promtail) has been the de facto way to ship logging data from applications hosted in AWS and AWS-native services to Grafana Cloud Logs. This approach is versatile, but it can get really expensive as your log volume grows.

The analysis above, which was done using the AWS Pricing Calculator, gives a rough idea of the cost trends associated with using Lambda vs. Firehose to ship logs from AWS. As you can see, Logs with Lambda can quickly become 3x more expensive than Logs with Firehose.
With AWS Lambda, CloudWatch Logs triggers one invocation per log entry. Lambda charges per invocation, so that approach can get expensive really quickly. On the other hand, Firehose is a stateless component, with no runtime that can fail (in comparison to Lambda), and it’s designed to batch and send data. Also, you’re billed by data volume, not by count, which makes Firehose the perfect solution for streaming a large volume of logs.
So if your data goes through CloudWatch, you should use Logs with Firehose. This approach also works for other services, including VPC Flow Logs, AWS WAF, and Route 53. However, there are still some scenarios where Firehose is not a viable option. For example, load-balancer access logs can only be shipped via Lambda at the moment.
Note: All third-party AWS logging solutions will incur additional costs on your AWS bill. The question for us is this: How low can we get that cost for our users?
As of publication, the only extra cost for using Logs with Firehose is the Firehose delivery stream. For this component, AWS charges per byte processed, so it has no reservation cost. On the Grafana Cloud side, there are no charges for queries in Grafana Cloud. You only pay for storing each ingested byte (beyond our forever-free tier), which is true for all ingested log data.
A holistic view of your AWS environment
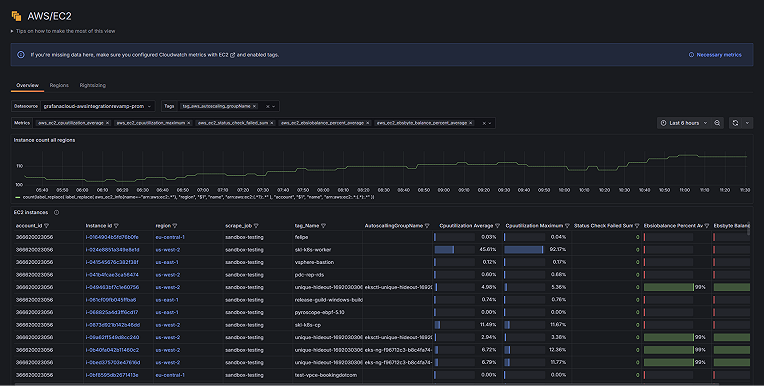
While Logs with Firehose makes it easier and cheaper to ingest your logs, the AWS Observability app provides a level of depth and customization you need to observe complex systems. Plus, by combining your infrastructure and application telemetry in Grafana Cloud, you get a holistic view of your system so you can reduce context switching and resolve issues faster.
Grafana Cloud is the easiest way to get started with metrics, logs, traces, dashboards, and more. We have a generous forever-free tier and plans for every use case. Sign up for free now!