GrafanaCON 2024: On-demand sessions are now available!
On April 9-10, we hosted our annual GrafanaCON event in Amsterdam. Focused on all things Grafana and its extended open source ecosystem, GrafanaCON 2024 had a jam-packed agenda, featuring two full days of technical talks and user success stories that highlighted all the incredible ways our community members use Grafana.
Today, we’re excited to share that GrafanaCON 2024 sessions are available on demand! So, if you weren’t able to join us in person at the sold-out event, you can now catch up on all the latest announcements, OSS updates, and inspiring community use cases — right from your home.
Here, we highlight a handful of the GrafanaCON 2024 on-demand sessions you can start watching today. To see the full line-up of on-demand sessions from the event, you can check out the GrafanaCON 2024 website.
From the Grafana Labs team
At GrafanaCON 2024, Grafana Labs team members shared the latest developments to our OSS projects, as well as best practices and insights to advance your observability strategy. Some of the on-demand sessions include:
GrafanaCON 2024 Opening Keynote
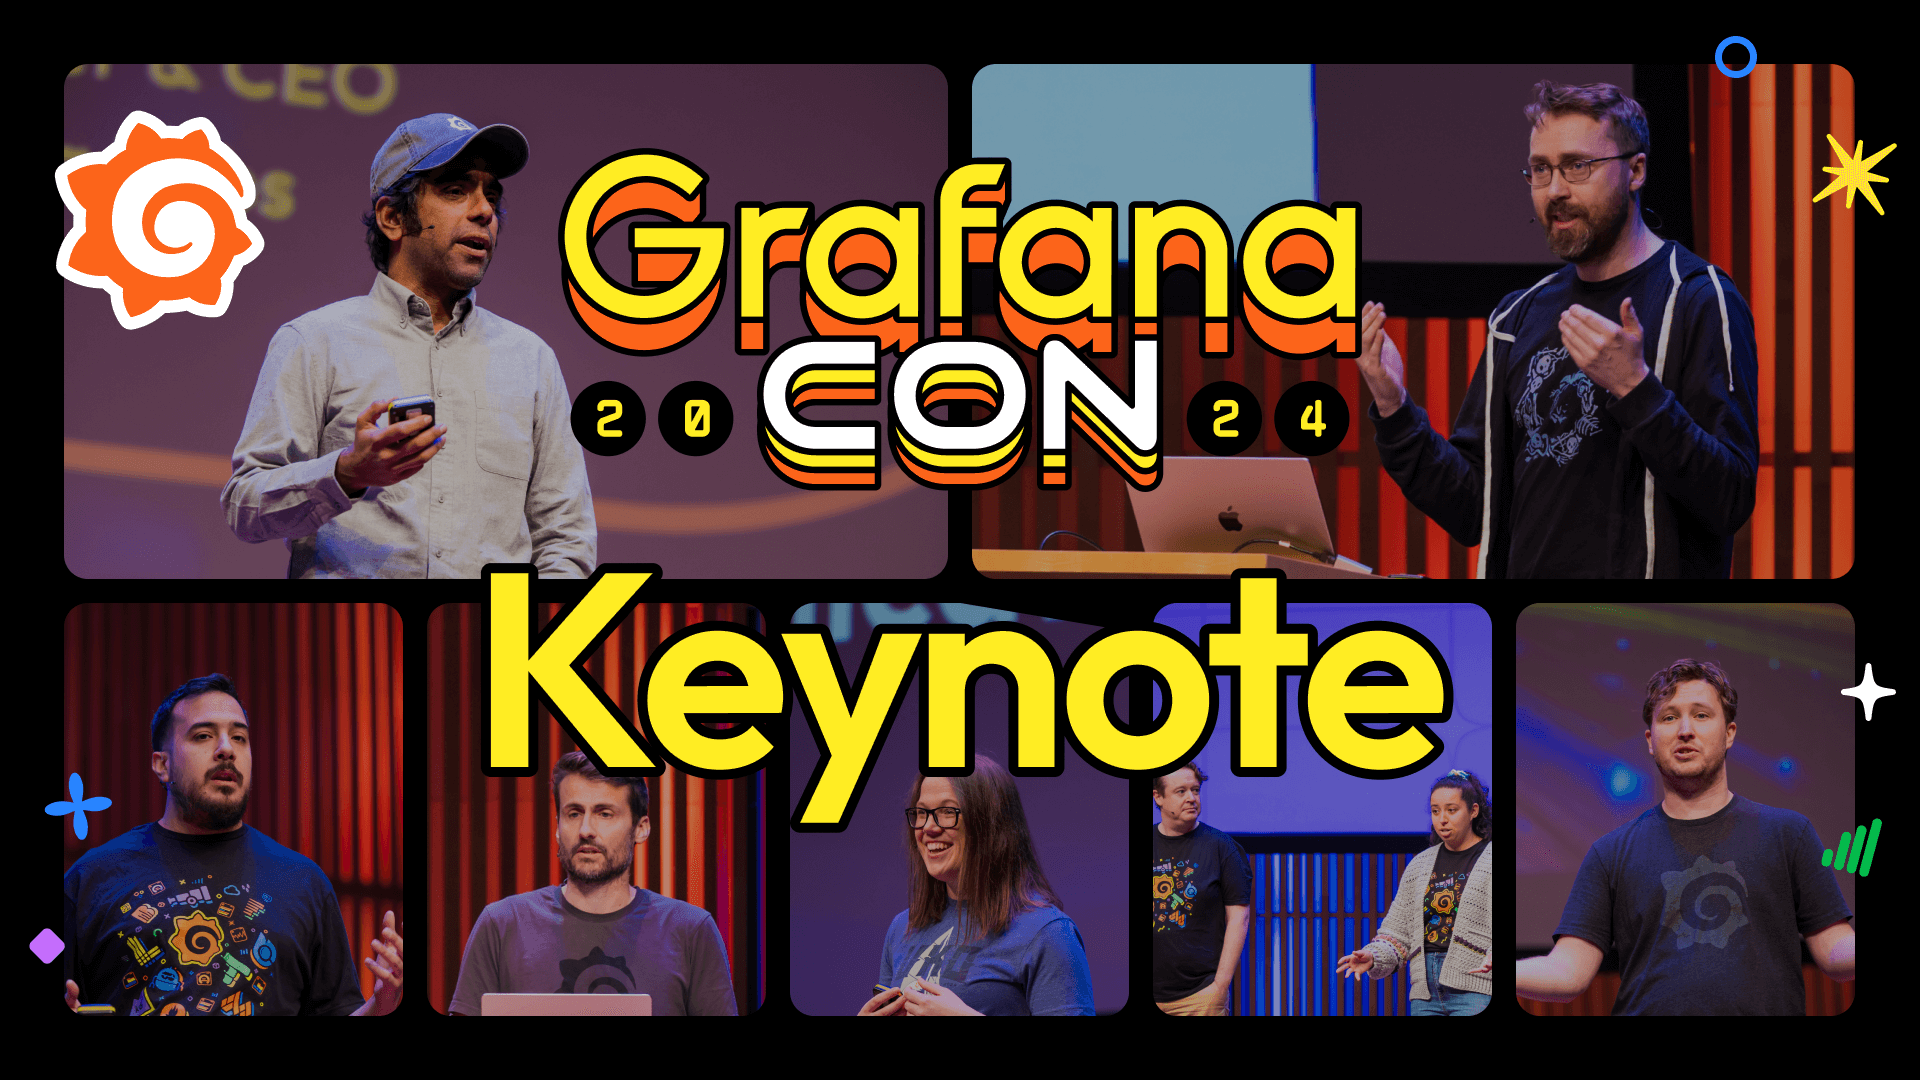
Grafana Labs CEO and co-founder Raj Dutt announces the winners of the Golden Grot community dashboard awards, and members of our engineering team make some exciting announcements around our open source observability projects. Lastly, Torkel Ödegaard, the creator of Grafana, unveils what’s new in Grafana 11.
Introducing Grafana Alloy, a distribution of the OTel Collector

Say hello to Grafana Alloy! Grafana Labs’ distribution of the OpenTelemetry Collector brings together the very best of OTel and Prometheus to offer a truly optimized hybrid experience, especially when paired with Grafana Cloud. Grafana Alloy uses components to build observability pipelines for telemetry collection, processing, and delivery. In this session, Senior Software Engineers Matt Durham and Paschalis Tsilias dive into the core concepts around Alloy and its configuration language, explore its new debugging capabilities, and show how to migrate to Grafana Alloy. They also discuss Grafana Alloy’s position in the OpenTelemetry landscape, its role as a collector, and how you can use it to collect OTel signals in parallel with your existing infrastructure. You will learn how to build OTel-native and hybrid pipelines using the supported OTel components.
Grafana 11 deep dive

In this session, you’ll dive into the details of what makes Grafana 11 a better way for you to connect to your data, visualize it in a beautiful and functional way, share it with others, and respond to incidents. In addition to an overview of what’s new in Grafana 11, this talk features demos of some of our favorite features.
For those operating Grafana, Director of Product Mitch Seaman and Engineering Director Mihaela Maior describe how Grafana 11 helps you:
- onboard new teams,
- manage your dashboards and alerts at scale, and
- manage upgrades, security, and larger environments.
Open source developers will also learn new ways to develop and publish applications, data sources, and panels to extend Grafana for its many uses.
5 years in, Loki turns 3.0
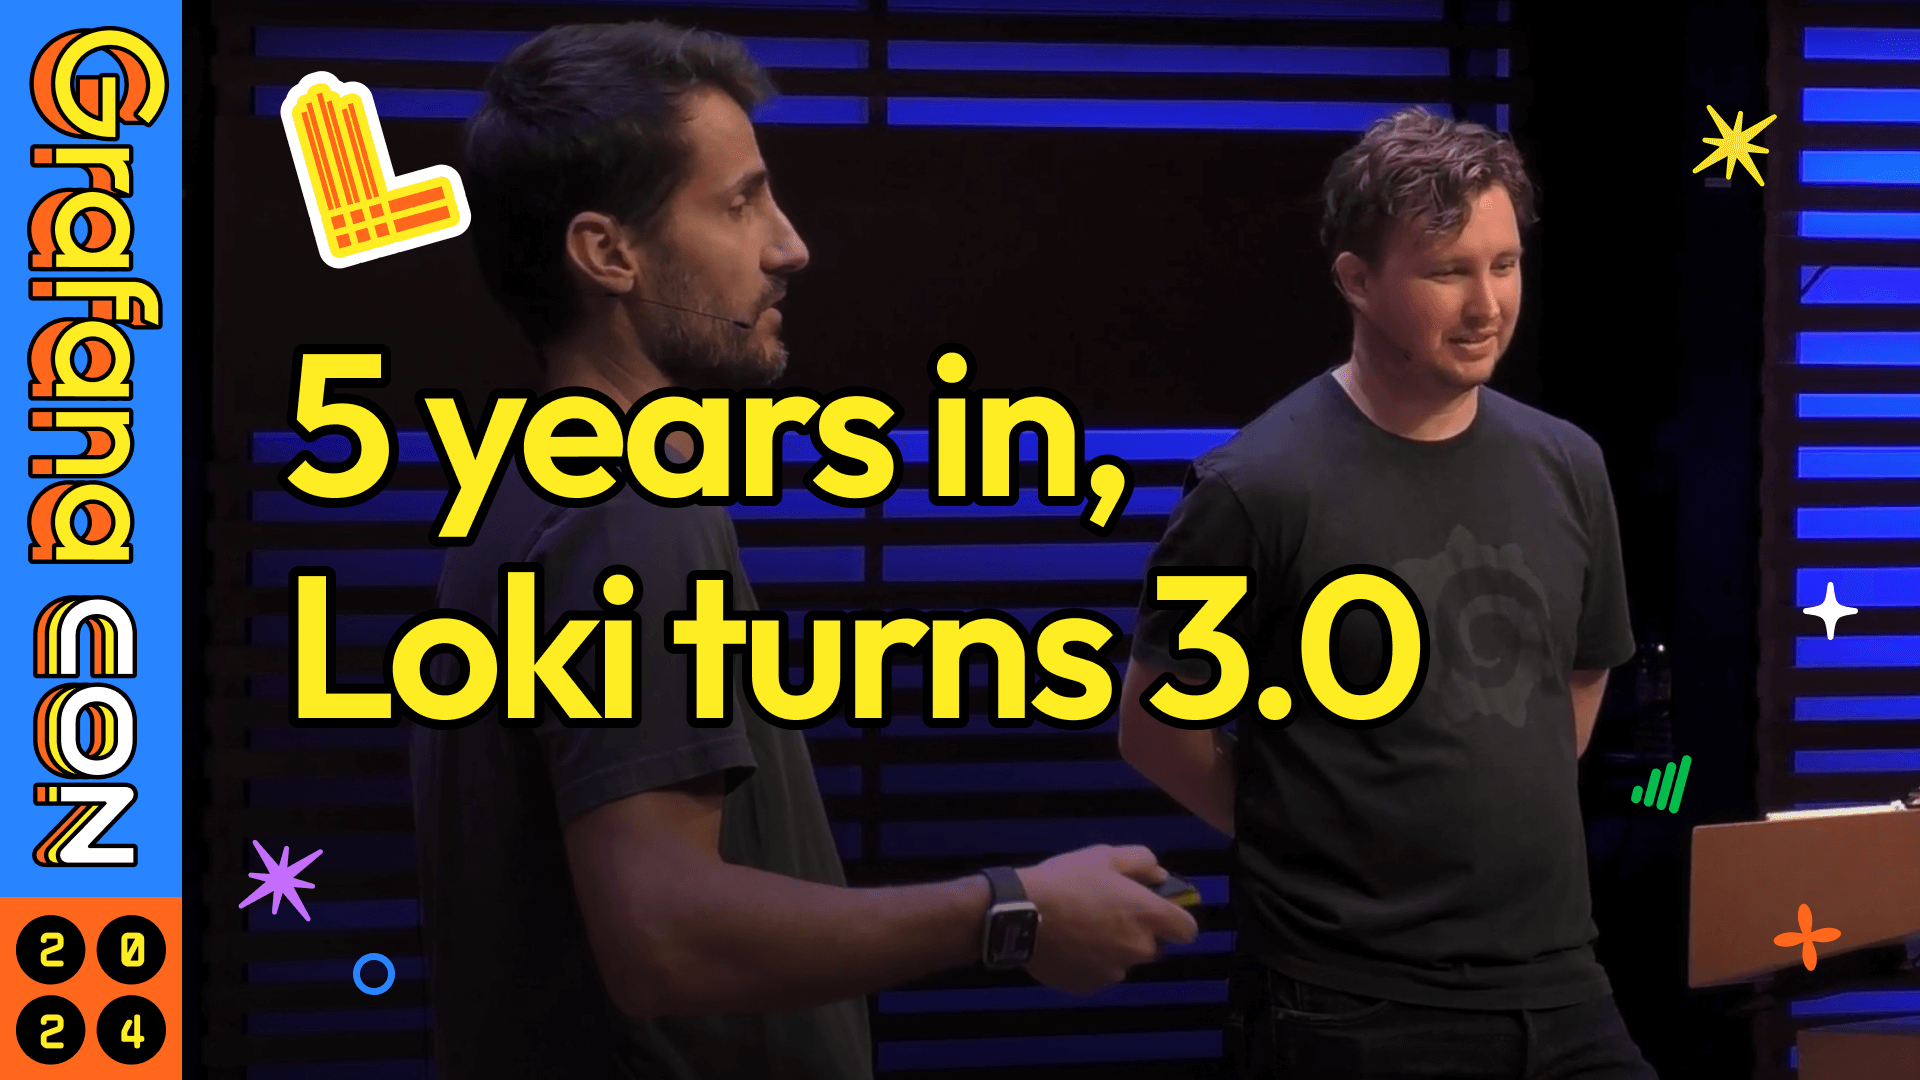
Grafana Loki was announced at KubeCon + CloudNativeCon in Seattle at the end of 2018, and five years later, the popular logging project has released version 3.0. In this session, Loki maintainer Owen Diehl discusses the highlights of the major release — native OTel support, bloom-filter query acceleration, and more — as well as what’s ahead: making Loki more of a general purpose tool for everyone, with higher scale, lower user-facing complexity, and lower cost.
A user’s guide to the open source Grafana App Platform

Based on the lessons learned from building and running the SLO app, Grafana Labs has launched the open source Grafana App Platform to help developers create similarly complex apps tightly integrated with Grafana. In this talk, Distinguished Engineer Ryan McKinley and Senior Software Engineer Stephanie Hingtgen demonstrate the app platform’s main features, including schemas and versioning for objects and APIs, object storage, watching objects, admission control for objects, and as-code capabilities.
From the community
User voices are a cornerstone of any GrafanaCON event. This year, community members took to the stage to share how they’re using Grafana and its extended open source ecosystem for some fascinating, creative, and (quite literally) stellar use cases. Some of our on-demand GrafanaCON 2024 user stories include:
How CERN monitors the world’s largest computing grid with Grafana and Mimir
The European Organization for Nuclear Research (CERN) may be famous as the home of the Large Hadron Collider (LHC), which produces around one petabyte of data every day, but not many people know about the computing infrastructure surrounding that impressive machine. CERN has its own data centers for collecting the data from the experiments and making it available to physicists all around the world. The CERN data centers also serve as the core tier of the world’s largest computing grid, WLCG, connecting over 170 sites from 42 countries with the accumulated power of about 1.4 million computer cores. In this talk, CERN Computing Engineer Nikolay Tsvetkov provides an overview of the CERN Monitoring Service and how it leverages Grafana and Mimir to deliver essential monitoring information to IT service managers and WLCG experts most effectively.
Grafana in space: Monitoring Japan’s SLIM moon lander in real time

On January 19, Japan became the fifth country to land on the moon — and Grafana was there! In this session, JAXA Associate Senior Researcher Satoshi Nakahira presents an overview of the ISAS space science missions and the SLIM lunar lander, and discusses how the team uses Grafana for the space agency’s real-time status monitoring system for science satellites and probes, including the implementation and actual data from the SLIM moon lander operations.
How Planted ramps up food production faster with Grafana’s single pane of glass

Plant-based meat is a rapidly growing industry, driven by the increasing demand from consumers seeking to reduce their animal meat consumption without sacrifice. In this highly competitive market, the speed of product improvement, innovation, and production ramp-up is crucial. In this session, Planted Head of Data Science Mathias Pawlowsky discusses how the Zurich-based food tech company utilizes Grafana as the single pane of glass for all production data, and how that easy access to data enables better and faster decisions, faster ramp-ups, and ultimately the delivery of more plant-based protein food to the world. You will hear how Grafana’s core features help the production team monitor machines and analyze process data for root cause analysis, and how Grafana’s extensibility through plugins allows them to collect human input through the data manipulation panel, analyze images, and even control machines through API calls with the Infinity plugin.
From silence to signals: Data management and monitoring at The National Library of the Netherlands
To secure its mission to preserve and provide Dutch literature for the digital age, The National Library of the Netherlands made a major shift from a static data environment to an interactive, signal-rich monitoring platform. In this talk, Platform Engineer Gerard van Engelen explains how implementing Grafana visualization, metrics from Mimir, and logs from Loki helped The National Library of the Netherlands gain valuable insights into its digital landscape, from performance issues to security issues. The National Library of the Netherlands’ journey serves as a compelling case study for other cultural and historical institutions aiming to modernize their data management and monitoring systems.
You can check out all of these on-demand sessions and more on the GrafanaCON 2024 website. And if you want to explore other upcoming events — both in-person and virtual — check out the Grafana Labs events page.

