Going green: How to monitor your cloud carbon footprint using Kepler, Prometheus, and Grafana
At this point, the technical and operational benefits of cloud computing are pretty much indisputable. But the cloud industry, as a whole, still has a long way to go in one critical area: sustainability.
In fact, as shocking as it may sound, it’s estimated that cloud data centers have a greater carbon footprint than the entire aviation industry. Ida Fürjesová and Niki Manoledaki, both software engineers at Grafana Labs, are passionate about helping to change that.

That’s why, at PromCon 2023 in September, Ida and Niki — who is also a contributor to the CNCF Environmental Sustainability Technical Advisory Group (TAG ENV), and co-chair of the Green Reviews Working Group — presented a bottom-up approach for monitoring energy consumption and carbon emissions related to cloud applications and infrastructure.
“Our focus is on advocating for green IT in the cloud-native ecosystem,” Niki told attendees.
The idea for their session — called “Using Green Metrics to Monitor your Carbon Footprint” — stemmed from a Grafana Labs Hackathon project that focused on green metrics and sustainability in cloud computing.
Today, in honor of Earth Day, we’re recapping Niki and Ida’s PromCon talk to share some of their lessons learned and best practices, so you can start monitoring your own cloud carbon footprint. You can also check out the full PromCon session below on YouTube.
Why and how to monitor your energy consumption
GreenOps — the practice of prioritizing sustainability in cloud-related decisions and operations — has, of course, major environmental benefits. But, Ida explained, the advantages of GreenOps actually extend far beyond the concept of sustainability itself.
“Sometimes when we reduce our resource usage, we also reduce cost,” she explained to PromCon attendees. “For instance, if we get rid of zombie clusters and zombie pods, we’re saving some costs”.
Organizations who embrace GreenOps and strive for more sustainable computing models also benefit from optimized app performance and a competitive edge in their markets.
“It’s great for marketing and for investors to see that you work for a green company, and customers feel better about using your products,” Ida explained.
But how exactly do you reduce the carbon footprint of your infrastructure and software? To start, you have to measure the energy consumption and carbon intensity of the applications you run and the tools you build.
“The first step to reduce your emissions is to actually know how much you’re emitting,” Ida said.
Fortunately, engineers can set up easy monitoring flows for gathering green metrics using the Kubernetes Efficient Power Level Exporter (Kepler), an eBPF energy monitoring tool and CNCF sandbox project.

Kepler works by aggregating energy metrics, using either RAPL or an estimation model. RAPL, which stands for Running Average Power Limit, is an Intel technology that aggregates and exposes energy metrics from processors. If RAPL can’t be used — for example, in VM environments, you won’t have access to RAPL because of the hypervisor — Kepler instead uses an estimation model, which is a trained machine learning model.
Kepler uses eBPF to attribute power to processes, and then to pods.
“eBPF will look at the energy metrics and associate those with the cgroup ID and the container and pod that are matching,” Niki said. “That way, you can have pod-level energy metrics, as well as node-level energy metrics.”
Then, Kepler can export those metrics to Prometheus.
Visualizing energy metrics in Grafana
Niki then discussed, and showed some examples of, Grafana visualizations for these Kepler energy metrics.
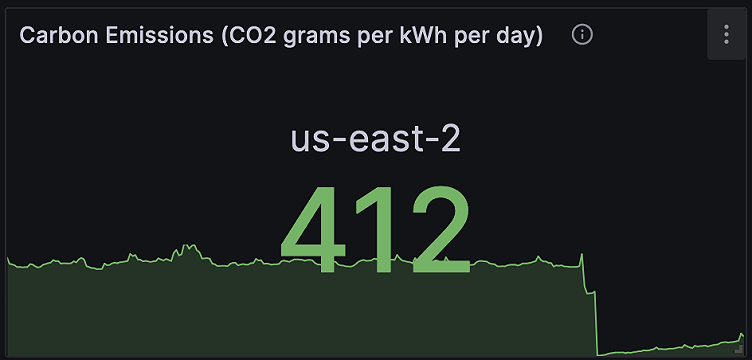
The image below includes a visualization of carbon emissions from a cluster running in the AWS us-east-2 region. Specifically, it’s showing the CO2 grams per kilowatt hour per day. Niki explained that the team looked at three nodes, in particular, and used a node label selector to target the nodes they wanted in the namespace they wanted.

Below the panel, you can see the associated PromQL query. Niki pointed out that the container namespace is “hosted_grafana”, and that kepler_container_joules_total is used to aggregate GPU, CPU, memory, and other related energy processes.
“We used a hard-coded variable for watts per second to kilowatt hour,” Niki continued. “This is a standard conversion of energy metrics. Another hard-coded variable, in this case, is the carbon coefficient.”
Niki noted that this particular query is a work in progress. There can be issues, for example, if there are certain kilowatt hours with no corresponding samples. “We welcome you to propose enhancements and improvements, as there are definitely other ways to do this, but this is what we are working with.”
Next, Ida showed another example of a Grafana panel for Kepler energy metrics — this time, displaying power consumption per pod or tenant ID.

“If you decide to implement Kepler on your clusters, this [panel] could be great to show your customers how much power consumption their applications have,” Ida said. “It can also help engineering teams know if power consumption changes between releases, and if it increases or decreases as new features are enabled.”
What’s next — and how to get involved
At the end of their PromCon 2023 talk, Ida and Niki outlined next steps and emerging use cases for monitoring energy metrics using Kepler and Grafana.
For example, Niki said, the CNCF Environmental Sustainability TAG’s Green Reviews Working Group is currently using infrastructure, called the community cluster, with credits that were donated by Equinix to the CNCF. They are building a pipeline with Infrastructure as a Code, Prometheus, Kepler, and Grafana, among other tools, to measure the energy consumption of various CNCF projects, starting with Falco.
Niki and Ida encouraged attendees to contribute their own sustainability and green computing ideas by joining the #tag-environmental-sustainability Slack channel for the CNCF. For more information, you can also check out the GitHub repo for the Environmental Sustainability TAG.
“You’re very welcome to join and contribute,” Niki said. “We have regular meetings, too, that are open to everyone, and I’m happy to talk about this more.”
Want to learn more about cloud sustainability? Check out these other recent talks featuring Niki:
- KubeCon 2023: Keynote: Environmental Sustainability in the Cloud is not a Mythical Creature
- KubeCon 2023: CNCF Environmental Sustainability TAG Updates and Information
- KubeCon 2024: Lightning Talk: Debunking Myths about Environmental Sustainability in the Cloud, Building a Greener CNCF Landscape
- A RedMonk Conversation: CNCF’s Environmental Sustainability TAG

