
Grafana Cloud updates: explore metrics without PromQL, native OpenTelemetry log support, cool panels, and more
We are consistently releasing helpful updates and fun features in Grafana Cloud, our fully managed observability platform powered by the open source Grafana LGTM Stack (Loki for logs, Grafana for visualization, Tempo for traces, and Mimir for metrics).
This month is no exception. At GrafanaCON, our annual community conference which was held in person in Amsterdam, we unveiled a host of new features to help you dive into metrics without writing a single query (you read that right), fun additions to the ever-popular Canvas panel, native support for OpenTelemetry logs, and more.
In case you missed it, here’s a roundup of the latest and greatest upgrades for Grafana Cloud this month. You can also read about all the features we add to Grafana Cloud in our What’s New in Grafana Cloud documentation.
And if you’re not a Grafana Cloud user . . . what are we waiting for? You can try any of these features for free with our generous Cloud Free plan. Sign up for an account today!
New in Grafana dashboards and visualizations
Explore Prometheus metrics without writing queries
What if you could query and troubleshoot in Prometheus without having to write PromQL? Say hello to Explore Metrics, a new queryless experience for exploring and drilling into your Prometheus metrics within Grafana.
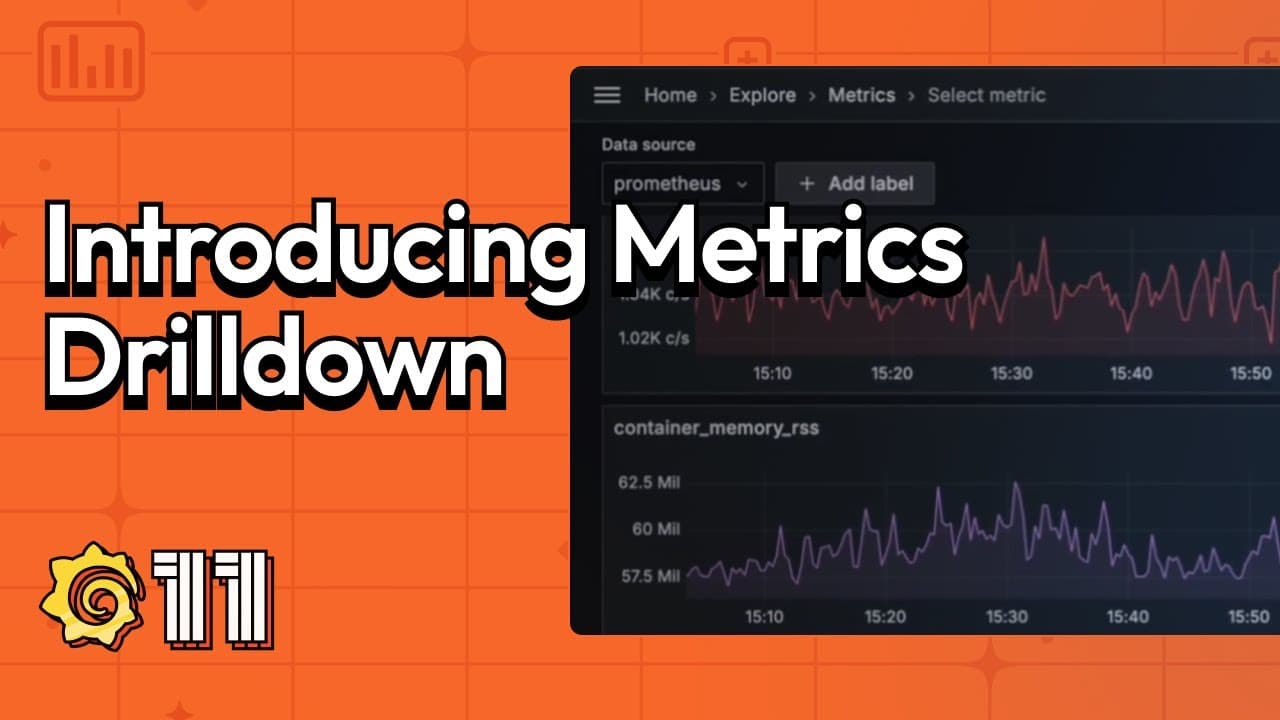
With Explore Metrics, you can find or select a metric name and immediately see the appropriate visualization, whether your metric is a gauge, counter, or histogram. You can review your metric broken down by each of its labels, which makes it easy to spot anomalies by namespace, cluster, or any other attribute. This is an efficient way to narrow down the source of latency, errors, or other issues — and it’s entirely point-and-click.
To learn more, read our Explore Metrics documentation.
Color code table rows
In Grafana, you now have the ability to add a color to full table rows using the Colored background cell type in the table visualization. When you configure fields in a table to use this cell type, an option to apply the color of the cell to the entire row becomes available.
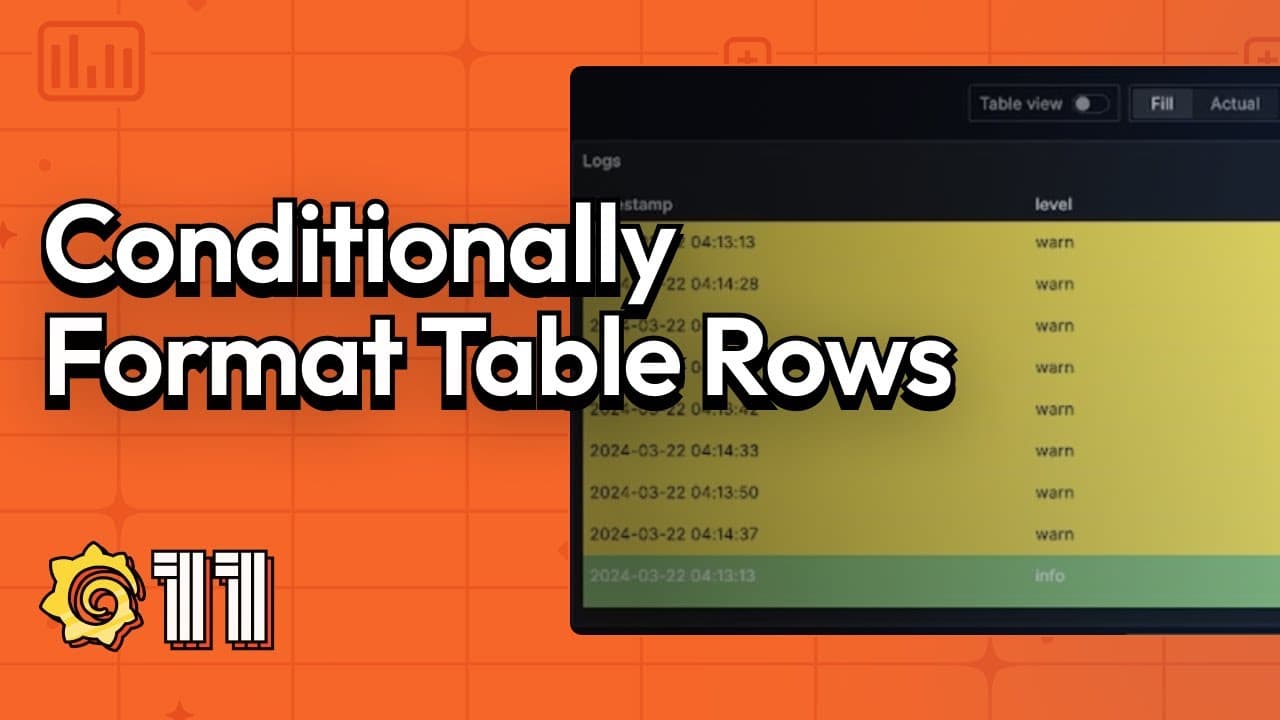
This feature is useful for a wide variety of use cases, including mapping status fields to colors (for example, info, debug, warning) and allowing rows to be color-coded based on threshold values. This is one of the ways we make formatting tables more seamless, and enable you to quickly scan data using the table visualization.
To learn more, refer to the table visualization documentation.
Improvements to the canvas visualization
Since we introduced the Canvas panel in Grafana 9.x, it has grown in popularity — and in functionality. Along with introducing the ability to pan and zoom and to add interactive buttons, we are excited to introduce the following enhancements for the Canvas panel.
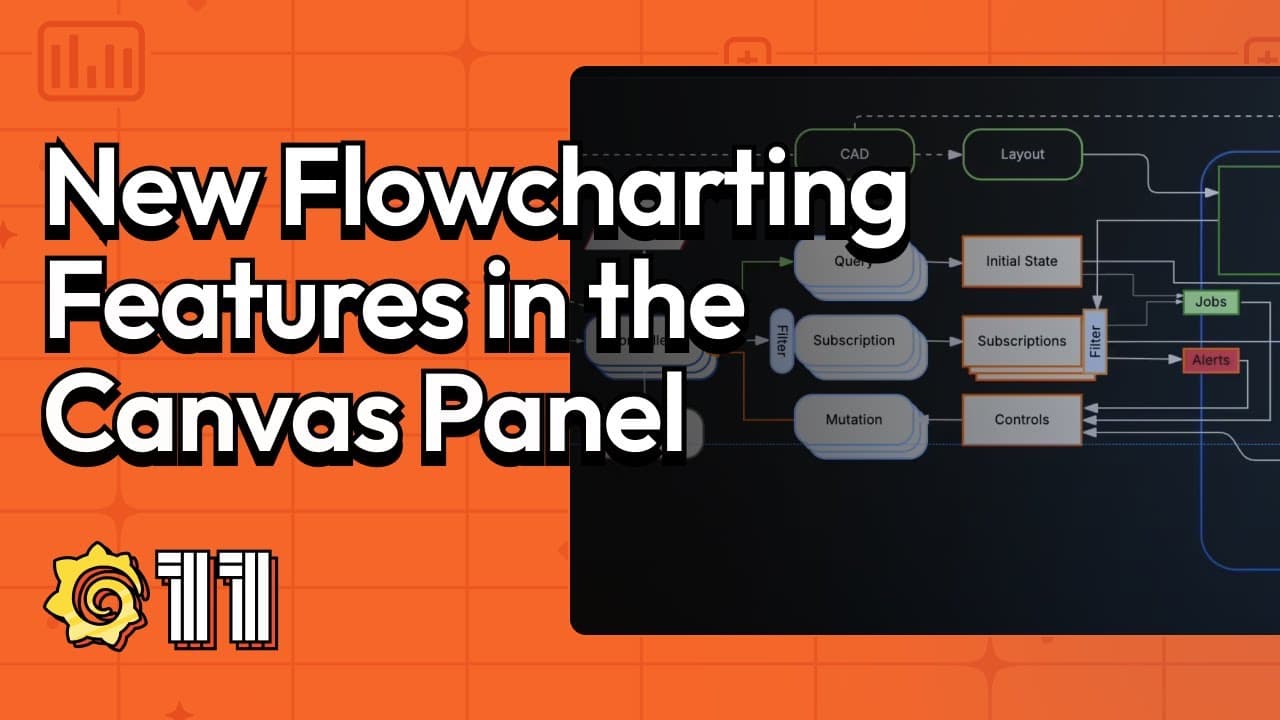
Flowcharting features: These improvements were in high demand within the community, and they include the addition of:
- Widely-used elements: cloud, parallelogram, and triangle
- Midpoint controls so that the connectors no longer have to be straight lines
- More connector styles, including dashed lines as well as corner radius and direction control
- Horizontal and vertical snapping for connectors
- Rounded corner styling for elements
- The ability to rotate elements in the canvas
Universal data link support: We’ve updated data links so that you can add them to almost all elements or element properties that are tied to data in the Canvas panel. Previously, you could only add data links to text elements or elements that used the TextConfig object. This update removes that limitation.
Infinite panning: With this new editor option, you can now view and navigate very large canvases. This option is displayed when the Pan and zoom switch is enabled. To this try out, contact Grafana Support to enable the pan and zoom feature in Grafana Cloud.
To learn more about all of these features, check out our Canvas panel documentation.
Scenes-powered dashboards
Last year, Grafana founder Torkel Ödegaard announced Scenes, our new frontend framework for Grafana dashboards. Now everything that comprises a dashboard — panels, variables, rows, time range, transformations, and sections — is a component that a developer can incorporate into an app.
Since then, we’ve been working on a major update of our dashboards architecture, which we are proud to announce has migrated to the Scenes library. This migration provides us with more stable, dynamic, and flexible Scenes-powered dashboards.
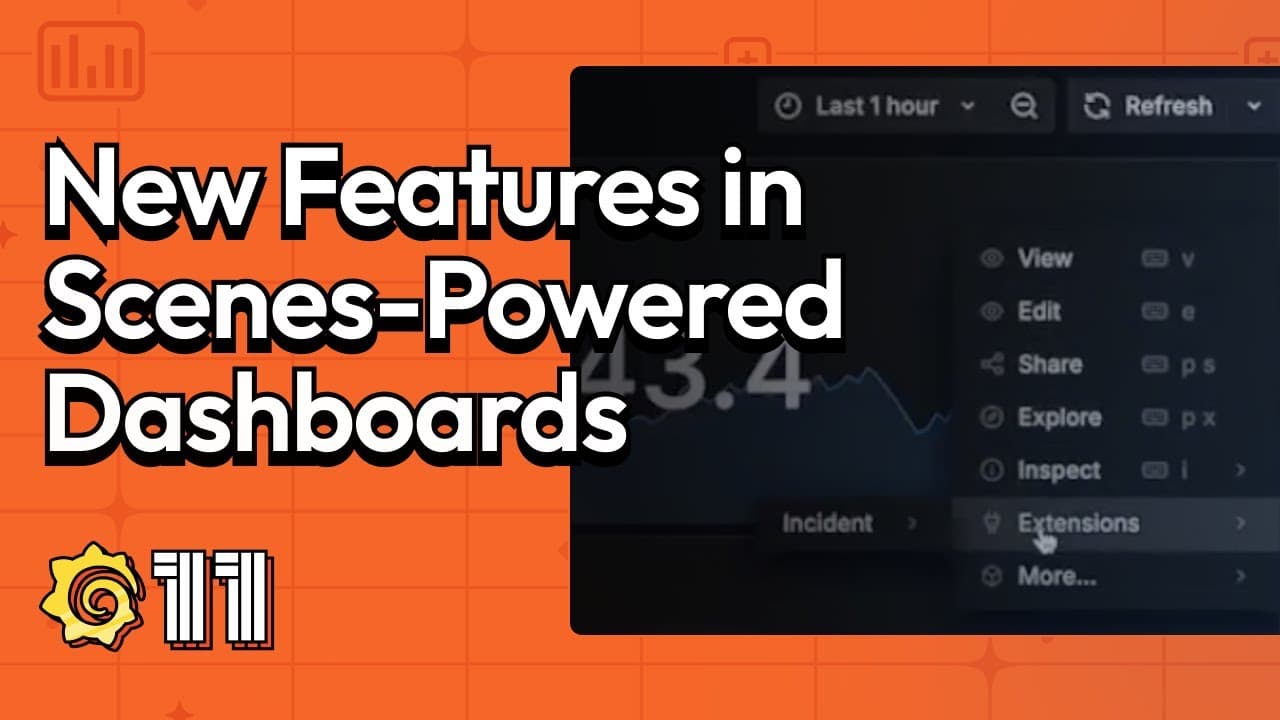
Want proof? Here are two improvements that we are introducing in Grafana:
- Edit mode: It’s sometimes hard to efficiently navigate through all the visual options during the dashboard editing process. With the introduction of the Edit mode, we aim to provide an easier way to discover and interact with the dashboard editing experience.
- Fixed positioning of template variables and time picker: We moved the time picker into the dashboard canvas and now, together with template variables, it will stick to the top as you scroll through your dashboard. This has historically been a highly requested feature that we’re happy to finally roll out for the community.
Improvements to manage Grafana at scale
Organize Grafana dashboards with subfolders
Dashboards go into folders, and now … folders can go into folders! Sounds like a small change, but the subfolders feature has a big impact.
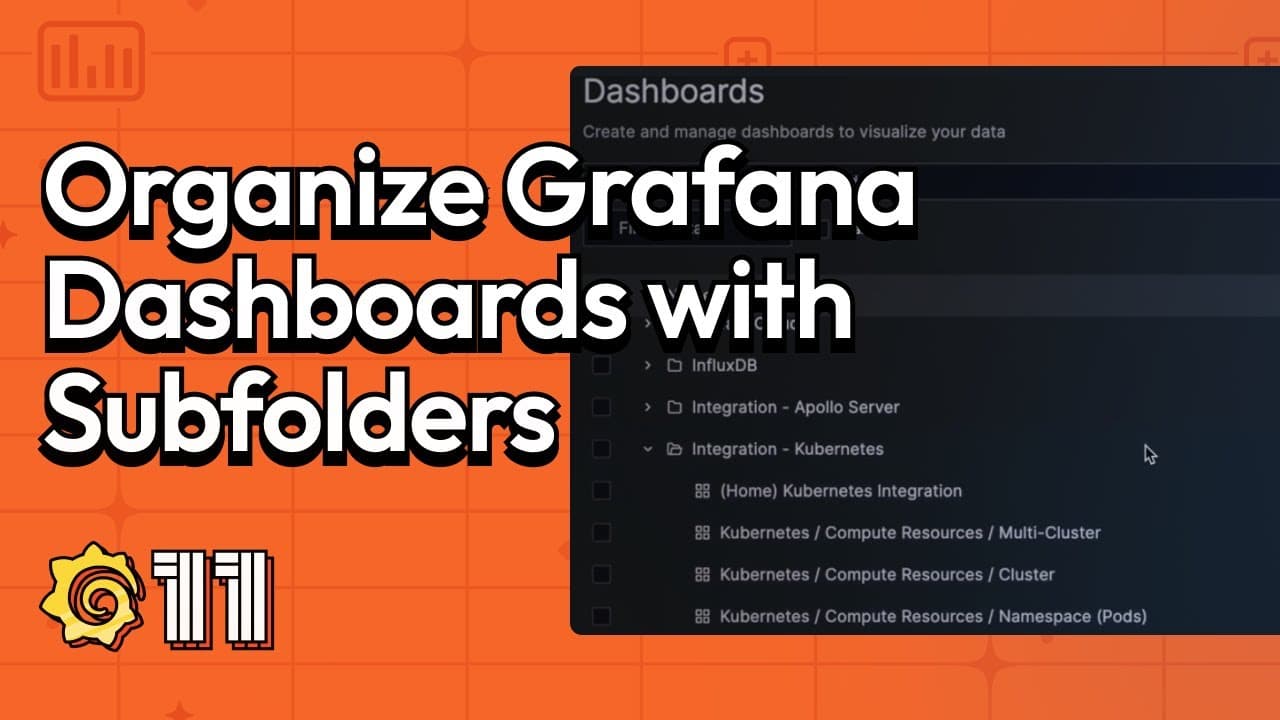
Some of you want subfolders as a guard against dashboard sprawl and setting up folders in a nested hierarchy helps with that.
Others will use subfolders to create nested layers of permissions, where teams have access at different levels that reflect their organization’s hierarchy.
Everyone will benefit from the organization and order that subfolders introduce into Grafana, especially as organizations scale their dashboard usage.
User-based authentication in Azure Monitor data source
With this new experimental feature, it’s now possible to limit users’ access to certain data within the Azure Monitor data source.
If you use Azure Monitor, you can forward users’ credentials along with their queries, so that everyone using Grafana can only access the Azure Monitor telemetry that they can see in the Azure console.
To learn more, read our Azure Monitor documentation.
Screenshot of Azure Monitor data source UI
PDF export improvements
The wait is over — at least for your PDF report. We’ve been working on a major update of the Grafana dashboard-to-PDF feature to make it work faster for larger, more complex dashboards.
The results: The PDF generation time will no longer be proportional to the number of panels in your dashboard. For example, a complex SLO dashboard containing roughly 200 panels has gone from taking more than seven minutes to only 11 seconds.
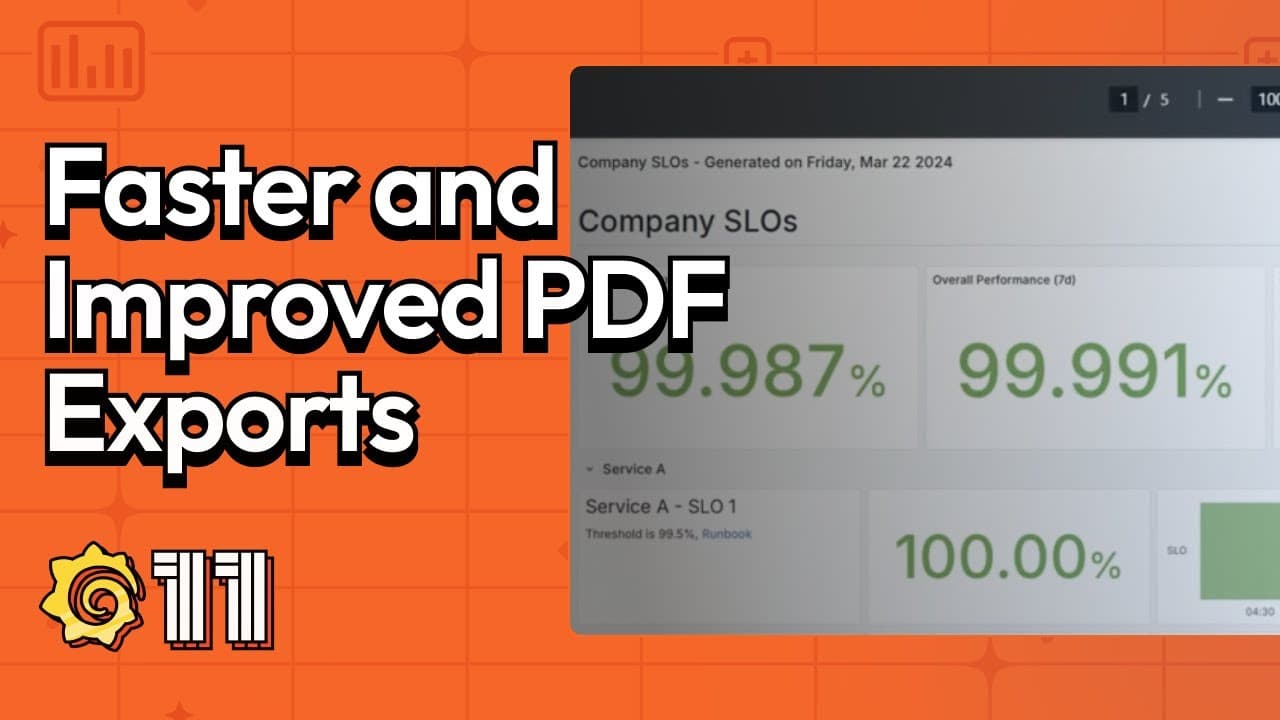
This update also fixes all caveats related to rendering a report with panels or rows set to repeat by a variable, such as rendering repeating panels inside collapsed rows.
To try this update, contact Grafana Support to enable this feature in Grafana Cloud.
The latest in Cloud Logs
Team label-based access control (LBAC)
Team LBAC (label-based access control) is our first step towards improving and simplifying data source access management based on team memberships in Grafana.

Available in Cloud Logs, Team LBAC controls access to logs depending on the rules set for each team in Grafana. So now teams can view the same data source but through the filer of their respective team’s label permissions.
This powerful feature allows Grafana administrators to reduce the total number of logging data sources per instance from hundreds to just one. Team LBAC also gives multiple teams the ability to access one dashboard because each team would have the appropriate access control rules applied to their use case.
To learn more about the features and best practices, go to our Team LBAC documentation.
Native OpenTelemetry logs support
While it was already possible to ingest OTel logs to Cloud Logs, it didn’t provide an optimal querying experience. To provide a native OTel logging experience to users opting for OpenTelemetry, we have added native OpenTelemetry ingestion support to Grafana Cloud Logs.
By leveraging structured metadata under the hood, Cloud Logs now provides a simplified syntax and better query performance for logs sent through our Cloud OTLP endpoint.
Built-in generative AI support
It’s easier to get started with generative AI features in Grafana Cloud.
Instead of configuring your own API keys, you’ll now find the LLM plugin in the Grafana Cloud console ready to go. To turn on generative AI features for your instance, just choose Use OpenAI provided by Grafana, accept the terms, and click Save & test.
Then try one of our AI-powered features:
- Explain flame graphs and offer suggestions to fix issues
- Suggest titles and descriptions for dashboards and dashboard panels
- Explain error log lines in Sift, our AI-powered diagnostic feature for incident response
- Auto-summarize an incident while resolving
To learn more, check out our LLM plugin documentation.
Share performance testing results as a Grafana dashboard
After you run a performance test in Grafana Cloud k6, the next step is often to share any findings with your team. Sometimes you may want to filter out some information and focus on specific metrics to share with your team members. Other times you might want to generate a PDF in an accessible, easy-to-read format to share with external stakeholders.

The new export summary functionality in Grafana Cloud k6 allows you to export your test results as a clear and comprehensive Grafana dashboard that includes panels and charts with key metrics, such as max throughput, HTTP failures, average response time, and more. You can then easily share the dashboard with other team members, edit it, or export it as a PDF.
To learn more, refer to the Export test results in the Grafana Cloud k6 documentation.
New and improved Grafana Cloud solutions
- PgBouncer. Get four alerts and three prebuilt dashboards to monitor metrics and logs from this lightweight connection pooler for PostgreSQL databases.
- OpenStack. Use Grafana Cloud to monitor your open source cloud infrastructure. This integration includes nine alerts and five prebuilt dashboards to monitor and visualize OpenStack metrics and logs, including dashboards designated for compute, networking, and storage.
- InfluxDB. Monitor and visualize metrics and logs for this open source time series database system commonly used for DevOps and infrastructure monitoring, IoT applications, real-time analytics, and more. This integration includes six alerts and three prebuilt dashboards to monitor your cluster.
- SQL Server. We’ve expanded the ways you can authenticate your credentials for our Microsoft SQL Server integration. In addition to existing support for SQL server credentials, we now also support Windows credential authentication.
See the full list of Grafana Cloud solutions, which include Kubernetes Monitoring, Linux, MongoDB, and more.
AngularJS deprecation in Grafana: How to prepare
AngularJS support in Grafana was deprecated in Grafana 9 and it will be turned off by default in Grafana 11, which will be released in May. When this happens, any plugin that depends on AngularJS will not load, and Angular-based dashboard panels will not show data.
To help with this transition, Grafana now displays a warning banner in any dashboard with a dependency on an AngularJS plugin. Warning icons are also present in any panel where the panel plugin or underlying data source plugin has an AngularJS dependency.
This complements the existing warnings already present on the Plugins page under the administration menu.
We’ve also developed an open source tool to detect-angular-dashboards. It can be run against any Grafana instance to generate a report listing all dashboards that have an AngularJS plugin dependency, as well as which plugins are in use. The tool also can also detect private plugins that have an AngularJS dependency; however, this particular feature only works with Grafana 10.1 or higher.
To avoid any interruptions in your Grafana dashboards, we encourage you to migrate to React-based visualizations and data sources included in Grafana or from the Grafana plugins catalog.
To learn more, refer to the Angular support deprecation documentation, which includes recommended alternative plugins, read our migration guide on the blog, and check out our video demo on how deprecation warnings work in Grafana.
Grafana Cloud is the easiest way to get started with metrics, logs, traces, dashboards, and more. We have a generous forever-free tier and plans for every use case. Sign up for free now!

