
How ComplyAdvantage built a more flexible observability strategy with OpenTelemetry and Grafana Cloud
In the fintech world, companies are constantly on the lookout for fraudsters and bad actors. ComplyAdvantage, which provides businesses with compliance and risk management tools, knows that one of the keys to uncovering money laundering and other crimes is having a clear picture of what is happening in a company’s systems.
In an ObservabilityCON 2023 presentation, Adam Wilson, the principal SRE at ComplyAdvantage, recounted how Grafana has been an important part of his team’s approach to observability. Over time, the company migrated from on-prem Grafana OSS to Grafana Cloud — with a stop in between with another proprietary cloud-based vendor that gave team members an even deeper appreciation of Grafana. OpenTelemetry, he explained, made it easier for them to make those two switches so they could explore their options and find the best solution to help them get the most out of their metrics, logs, traces, Kubernetes monitoring, and more.
Observability background
ComplyAdvantage deals with six billion spans per day, not including those that are flowing through Istio, an open source service mesh that helps run distributed, microservices-based apps anywhere. The company has about 41 Kubernetes clusters and nearly 2,000 nodes, and about 20% of its metric series are in OpenTelemetry, while the rest are in Prometheus.
The company had started with Grafana OSS, and when Wilson first joined, there was no federation, so everything in their observability stack was deployed into every single cluster. As a result, figuring out what was going on across two different clusters was a complicated process.
He said he felt like the company had “the constituent parts of a great open source observability stack,” but it wasn’t unified and it wasn’t serving his team’s needs, especially when they faced incidents. “At the end of the day, we had too many people with too much access to our production clusters,” he said. “And in a fintech that’s focused on compliance and data security, that wasn’t going to hold up.”
There was also another problem: Because of the culture around observability at the time, people wanted to keep their logs forever and wanted an increasing number of metrics, too. That caused ComplyAdvantage’s Prometheus servers to “fall over constantly,” Wilson said. “Basically, every single day I had an SRE who was off because they’d been up all night trying to keep the Prometheus servers up.”
Searching for a solution
To try and solve the problem, Wilson turned to OpenTelemetry. It was particularly appealing, he said, because it was open source and vendor-neutral. He said he also found a lot of value in OpenTelemetry because of its drop-in instrumentation. “You can start off with just a few lines of code and get maximum benefit from it. Once people in an organization start using it, he added,”they want more out of it because they start to realize the power of it.”
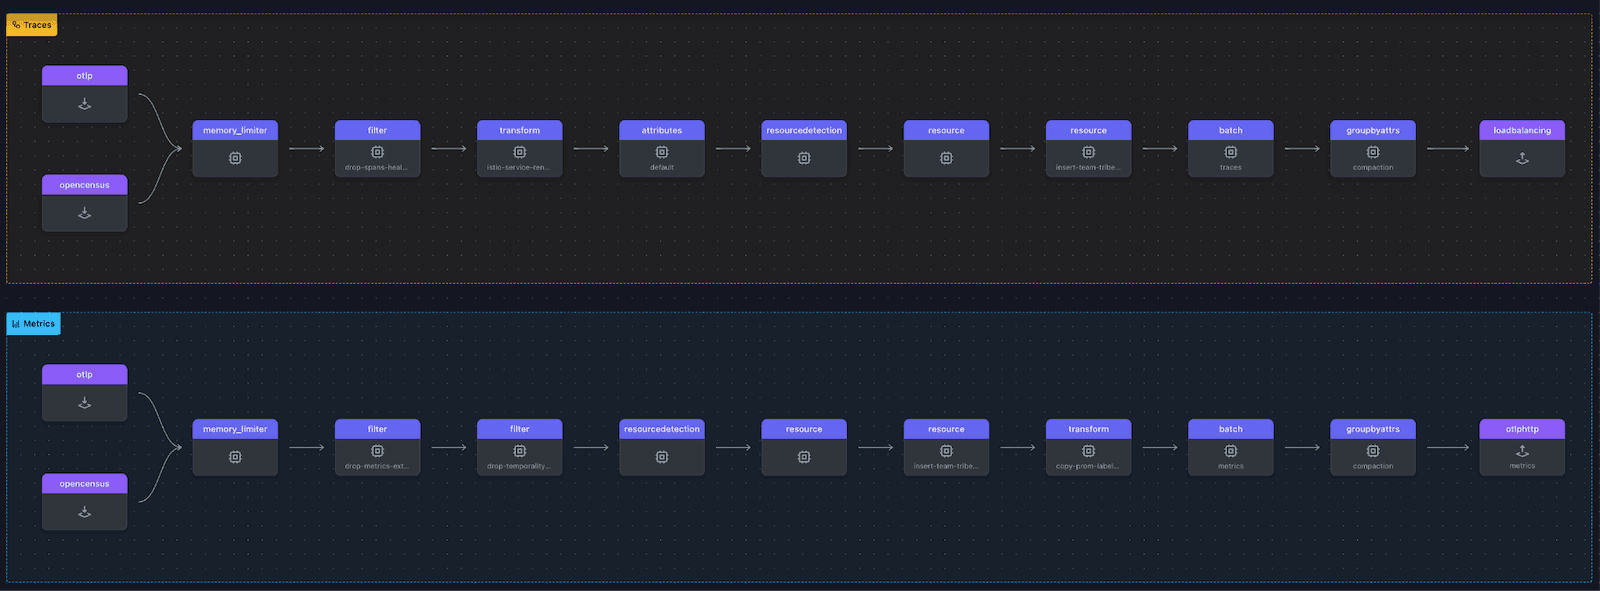
Wilson highlighted two pieces of the OpenTelemetry ecosystem that have played a role in ComplyAdvantage’s observability strategy: the OpenTelemetry Collector, a Go binary that absorbs a lot of different observability data types (he uses it for OpenCensus and OpenTelemetry); and OTelBin, a visualization tool to use with it.
To provide context, Wilson then shared a screenshot from Grafana Cloud, explaining what distributed tracing looks like in the backend. (For people unfamiliar with tracing, he pointed out that the whole picture is a trace and the bits under the top line are spans.)

The example above, he explained, is just touching on one application.
ComplyAdvantage’s Kubernetes clusters have Istio gateways that the requests touch before they come into the application pod, and those are tracked in the top line. Below that, in a different color, the team can visualize the Istio proxy, which runs as a sidecar inside the same pod as the application. Further down are the application operations happening within the app. “They’re all tied together with IDs, and all of this is just driven through request headers set out by the OpenTelemetry schema,” he explained.
ComplyAdvantage runs the OpenTelemetry Operator with several custom resource definitions (CRDs). They have a dedicated observability team that controls the deployment of the Operator and the configuration in associated sidecars. “What the Operator will do is actually inject the OpenTelemetry Collector binary into the application pod sitting alongside the application itself,” Wilson explained. What’s “really cool,” he said, is that wherever they have OpenTelemetry, they can use the exact same Go binary with slightly different configurations. “You can point one to the next, and you can build pipelines, that feed into pipelines, that feed into pipelines.”
In the OpenTelemetry gateway, the team put their final controls in place and could make sure they were tagging it with the right environment. To keep things simple for the support teams — and make it easy to communicate across the company — they created just three environments in their UI dropdown.
While OpenTelemetry handles traces, metrics, and logs, Wilson pointed out that it treats traces, in particular, “like a first-class citizen within observability.” When it came to shipping logs, Wilson said his company opted for a proprietary observability vendor rather than use OpenTelemetry.
Migrating to Grafana Cloud
After discussing his experience with sampling, Wilson moved on to ComplyAdvantage’s transition to Grafana Cloud. When the ComplyAdvantage team felt like their culture didn’t mesh with the proprietary observability vendor they chose — “It was very much like we were talking different languages,” Wilson said — they began to look, once again, for a new vendor for their observability backend.
After discussions with Grafana Labs, he said returning to Grafana “made absolute sense.” The fact that Grafana has an open source background was appealing, the technical teams from both sides spoke, and “everything gelled much, much, much better,” he said.
The timeline for ComplyAdvantage’s migration to Grafana Cloud was also much shorter than the first migration because they were using OpenTelemetry, Wilson explained. Given Grafana Cloud’s native integration with OpenTelemetry, they didn’t need to re-implement the SDKs again.

In ComplyAdvantage’s new observability infrastructure, their monitoring data from the apps goes into their gateways, which now use span metrics. Every trace that flows through that first layer of OpenTelemetry gateways has its metadata and metrics extracted and then shipped straight to Grafana Cloud.
“The first layer of OpenTelemetry gateways then uses a load balancing exporter to send all of the spans from the same trace into the second layer of OpenTelemetry gateways, where we make our sampling decisions,” Wilson explained. Both of those run as Kubernetes deployments, so he said that at the moment, they are basically hacking state into their observability infrastructure using request headers.
“We’ve swapped in Grafana Agent where we were using a proprietary agent previously,” he explained. “It handles the logs for us, and actually, we’ve added Prometheus running in agent mode back into our clusters to handle our metrics specifically for the Prometheus endpoints.”
RabbitMQ runs in some of their nodes, and they can scrape the RabbitMQ metrics and ship them up to Grafana Cloud along with everything else.
Big payoff
Once the migration to Grafana Cloud was complete, it shifted how people at the company worked. “I think the big thing for us was the change in the way that people started to tell stories with data,” Wilson explained.
For example, they would use traces (below left) to build pie charts (below right) that “opened up a conversation across the organization that had never happened before,” he said.

Previously, when ComplyAdvantage’s CEO wanted to know how many searches were run across the systems, finding the answer would require looking in different places and piecing together numbers. With traces, however, someone could just look at a dashboard to get an answer.
Even more importantly, the CEO can use information from the infrastructure data in a pie chart to help shape conversations with customers and partners about how they’re using ComplyAdvantage.
“Being able to have that impact on product, on sales, on that side of the business — just from getting some request headers into our applications — was revolutionary, really” Wilson said.
He noted there is one thing to bear in mind in terms of OpenTelemetry and vendor neutrality: “The technology might work with multiple vendors, but can you?” If you like one particular vendor’s “magic,” he said, and you rely more and more on their specific features, there’s no reason to panic about not being vendor-neutral anymore. “You can migrate,” he assured the ObsCON audience.
Looking ahead
After their migration to Grafana Cloud, ComplyAdvantage became an early adopter of Grafana SLO, a solution in Grafana Cloud that makes it easy to create, manage, and scale service level objectives, SLO dashboards, and error budget alerts. “It’s been quite cool as part of our relationship with Grafana Labs that we’re actually able to provide feedback on new projects and products that they’re developing,” he said.
Wilson said that the company is also glad to be working with an observability vendor whose culture matches the one at his organization. “It’s also really nice to see that we are now somewhere that we’re really happy and we’re able to work together in much more of a partnership.”
Grafana Cloud is the easiest way to get started with metrics, logs, traces, dashboards, and more. We have a generous forever-free tier and plans for every use case. Sign up for free now!

