Legacy alerting removal: What you need to know about upgrading to Grafana Alerting
Two years ago, when we launched Grafana 9, we announced the deprecation of legacy alerting and introduced Grafana Alerting, the new default alerting system in all editions of Grafana.
Since then we have invested in Grafana Alerting, making it easier to create and manage your alerts. Along the way we have also worked to make the transition from legacy alerting to Grafana Alerting as seamless as possible in preparation for the time when we remove legacy alerting altogether from Grafana.
That time is coming soon: With the upcoming release of Grafana 11, which will be generally available on May 14, we will officially remove legacy alerting from the Grafana codebase entirely. So whether you’ve been putting it off or just too busy with other projects, now is the time to upgrade to Grafana Alerting to avoid disruptions in your observability systems.
In this blog post, we’ll walk you through why you should make the switch if you haven’t already. We’ll also provide the resources you need to confidently make the move without interrupting your alerting system.
Who does this impact?
The removal of legacy alerting impacts a subset of Grafana OSS and Grafana Enterprise users (Grafana Cloud accounts have already been upgraded to Grafana Alerting). You can verify the alerting engine your installation is utilizing based on your current Grafana version and configuration:
- Grafana 7 and below all use the legacy alerting.
- Grafana 8 had an optional administrator opt-in to use Grafana Alerting.
- New installs of Grafana 9 and Grafana 10 default to Grafana Alerting engine and will not need any action unless you have explicitly opted out.
But the real question is: What happens if I don’t upgrade from legacy alerting to Grafana Alerting before installing Grafana 11?
The answer: Nothing good. Upgrading to Grafana 11 before upgrading your legacy alerts will result in losing all of your alerts, and you’ll be starting Grafana 11 with a blank alerting slate.
How to upgrade to Grafana Alerting
Your alerts are the eyes and ears of your observability stack, so we understand that some users are reluctant to touch them — especially if you’re dealing with thousands of alerts and aren’t sure who owns what. Other potential hurdles include retraining teams, rebuilding your CI/CD pipeline, updating your provisioning process, and adapting to the new API — all of which takes time, which is in scarce supply for most organizations.
To address these concerns, we built an upgrade preview tool in Grafana 10.4 that allows you to view, edit, and delete upgraded rules in a safe and controlled preview environment before cutting over to Grafana Alerting. If you are upgrading from one of the older versions of Grafana, we highly recommend that you upgrade to Grafana 10.4 first and take advantage of the preview tool to navigate the process more easily.
(Note: Grafana 10.4 is the last version that offers legacy alerting and the last version of Grafana where automatic alert upgrades will be available.)
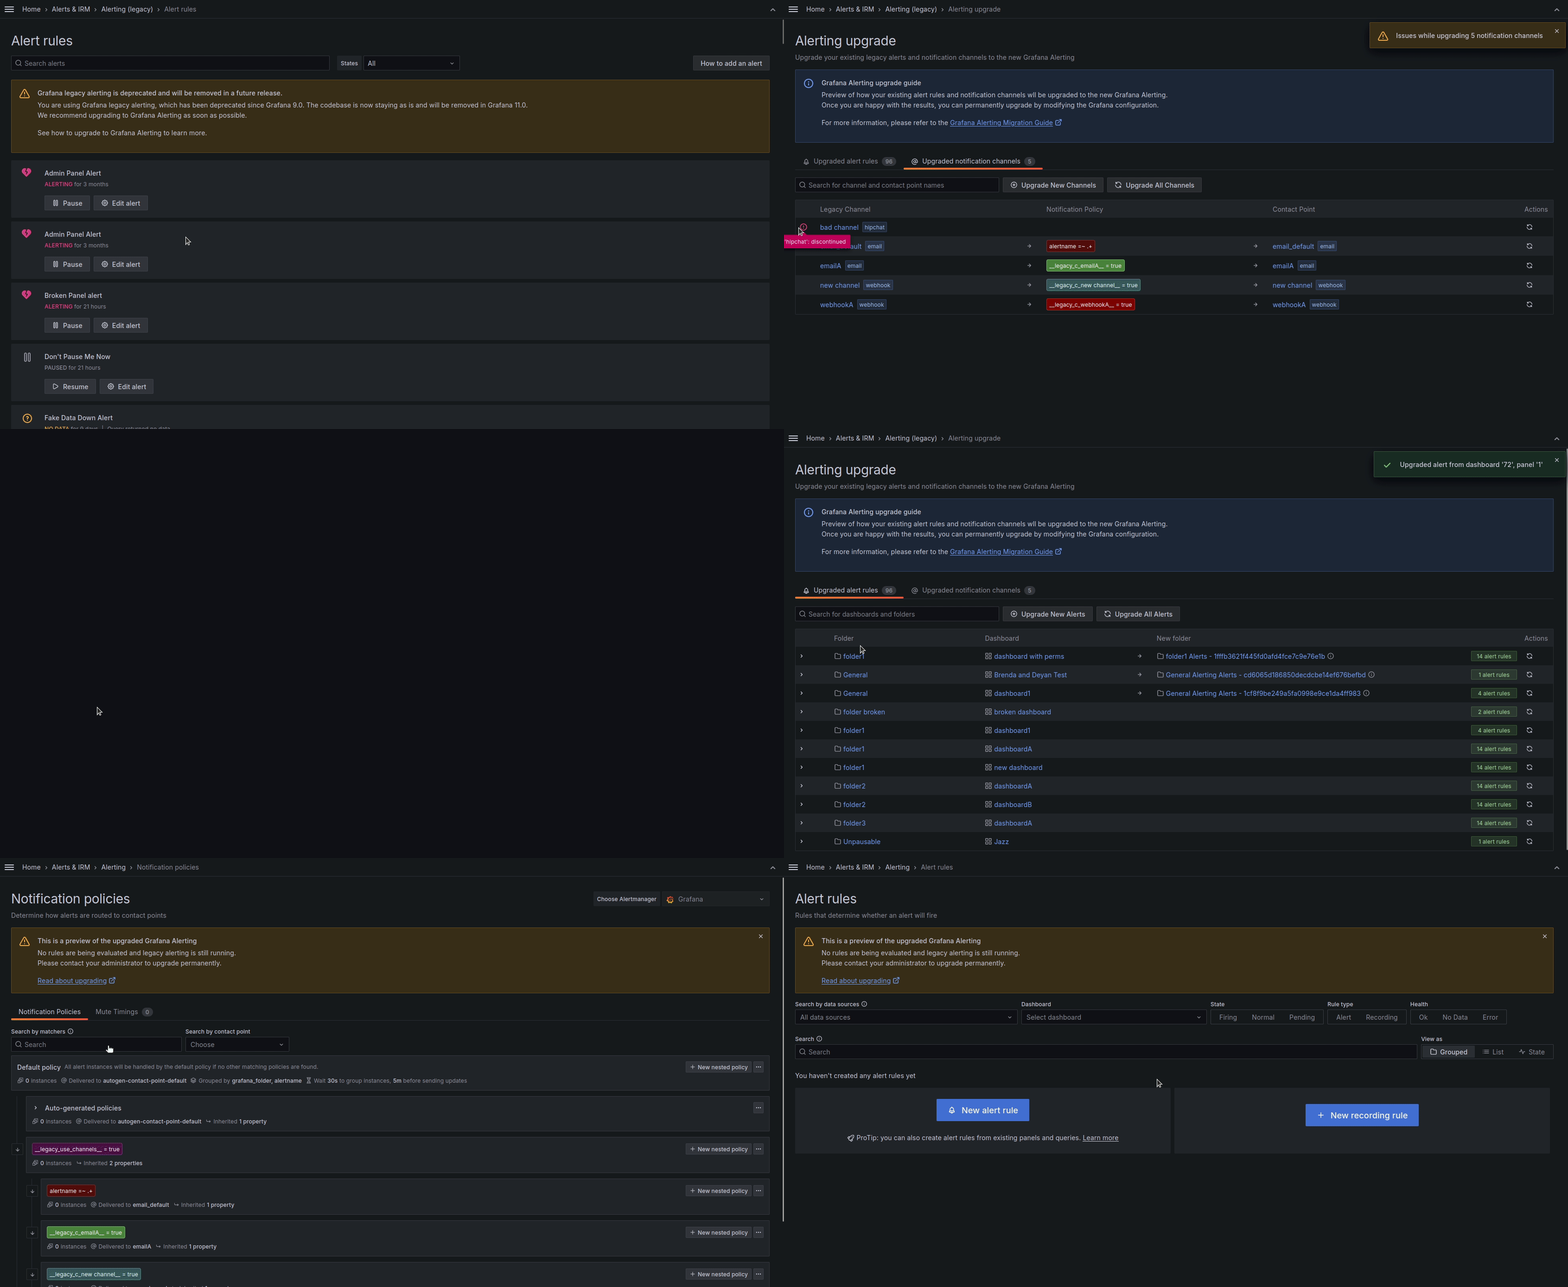
To use the preview tool, follow these steps:
- Go to the Alerting upgrade page in the Alerting (legacy) section of the navigation panel. From there you can upgrade your existing alert rules and notification channels to the Grafana Alerting system. You can also review the summary table for an outline of the changes.
- Examine the upgrade preview to identify and address any errors. New rules or notifications — as well as any that weren’t automatically upgraded — will be highlighted.
- If you use provisioning methods to manage alert rules and notification channels, you can export the upgraded versions to generate provisioning files compatible with Grafana Alerting. Make sure your as-code setup aligns with the new system before completing the process.
- Once you’re confident in the state of your upgrade preview, you can enable Grafana Alerting. Grafana organizations that have completed the upgrade will be able to continue with their configured setup, while those that haven’t will go through the traditional automatic upgrade during the restart.
More information and alternative methods to upgrade your legacy alerts can be found here.
The latest in Grafana Alerting
With Grafana Alerting, we decoupled alerts from dashboarding, making your alert system much more powerful and scalable. It was first introduced in beta with Grafana 8 to unify the alerting experience across Grafana OSS, Grafana Cloud, and Grafana Enterprise. It addressed some of the most up-voted issues in the Grafana community and officially became the default in Grafana 9.
Since then, we’ve listened to community feedback and refined the alerting system with quality-of-life improvements and innovative features. Here’s a brief overview of the benefits of Grafana Alerting and some of the features we’ve introduced over the years:
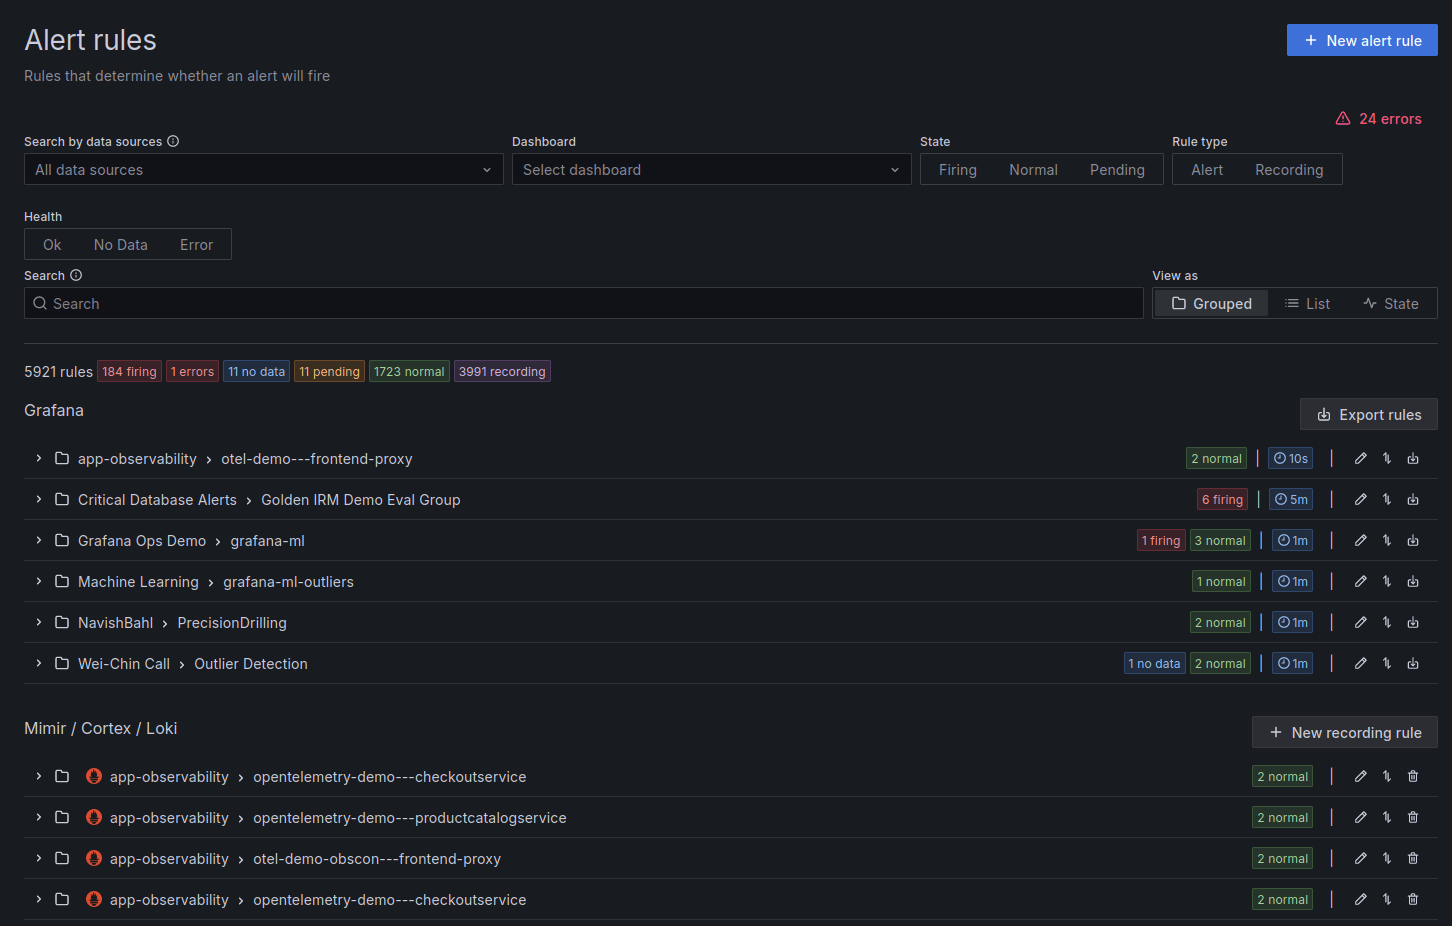
Single pane of glass
Easily manage all your alerts in one centralized system, reducing complexity and streamlining operations. With Grafana Alerting, you can bid farewell to scattered configurations and enjoy a cohesive alerting experience.
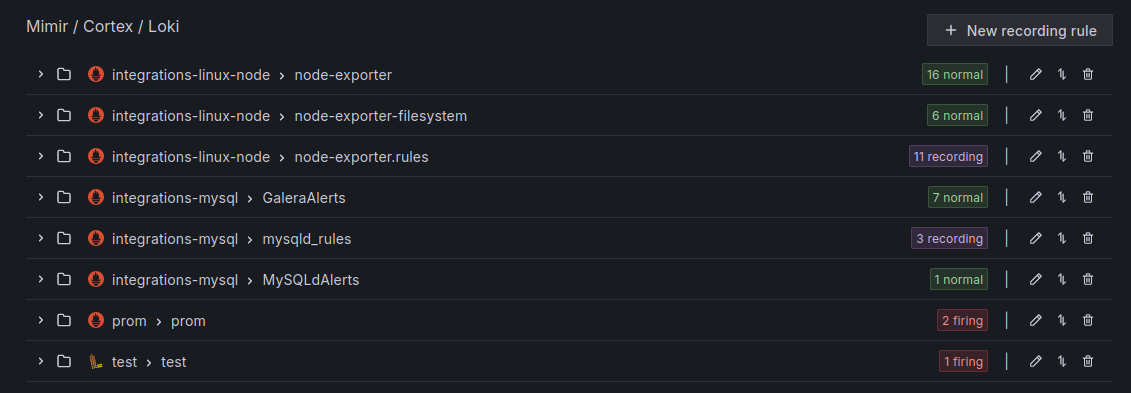
Prometheus integration
Leverage external Prometheus support for seamless monitoring and alerting in existing Prometheus-based environments, maximizing interoperability and efficiency. Grafana’s deep integration with both Prometheus ruler and alertmanager enables you to harness the full power of both platforms.
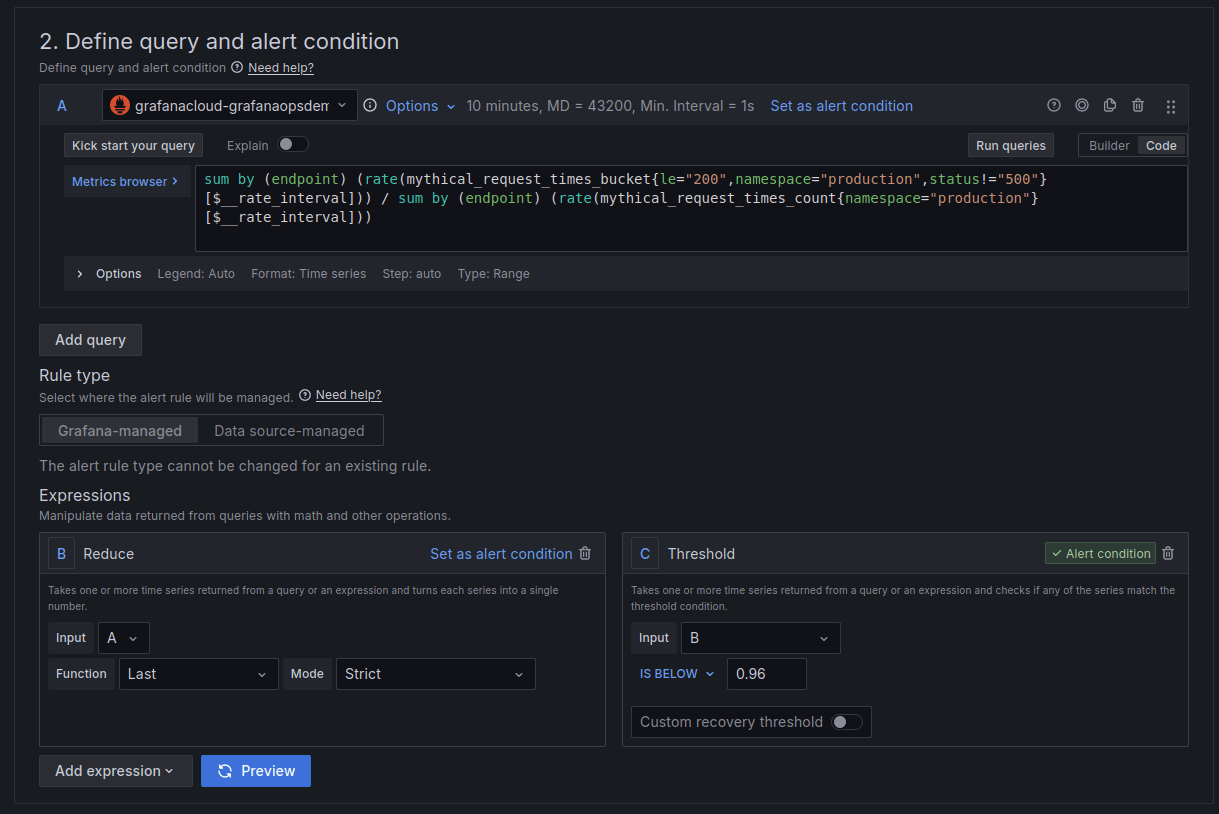
Powerful alerting rules
You can use advanced rules and expressions to create complex alert conditions from various underlying data sources and reduce alert rule spread with multi-dimensional rules. That means fewer alerts to manage and review, less noise, and a more responsive API and UI — all of which frees up your teams to focus on other projects and responsibilities.
Flexible notification management
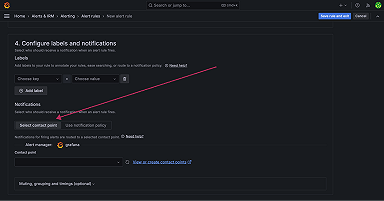
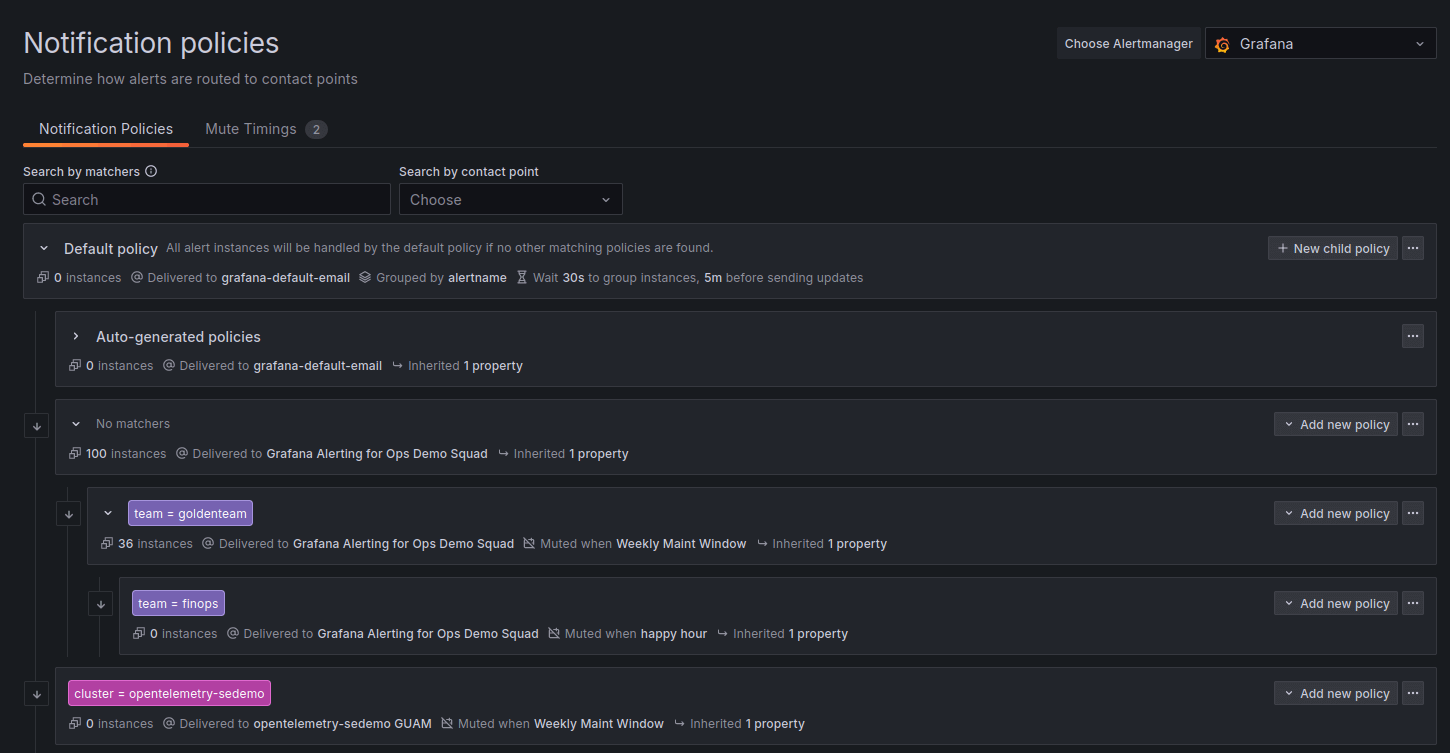
Route and prioritize notifications based on labels, simplifying setup and maintenance of more complex hierarchical or shared alerts. Ensure that critical issues are promptly addressed while responders are supported by flexible time-based silencing and scheduled mute timings.
For simpler use cases, configure routing directly on an alert using simplified routing.
Dynamic templating
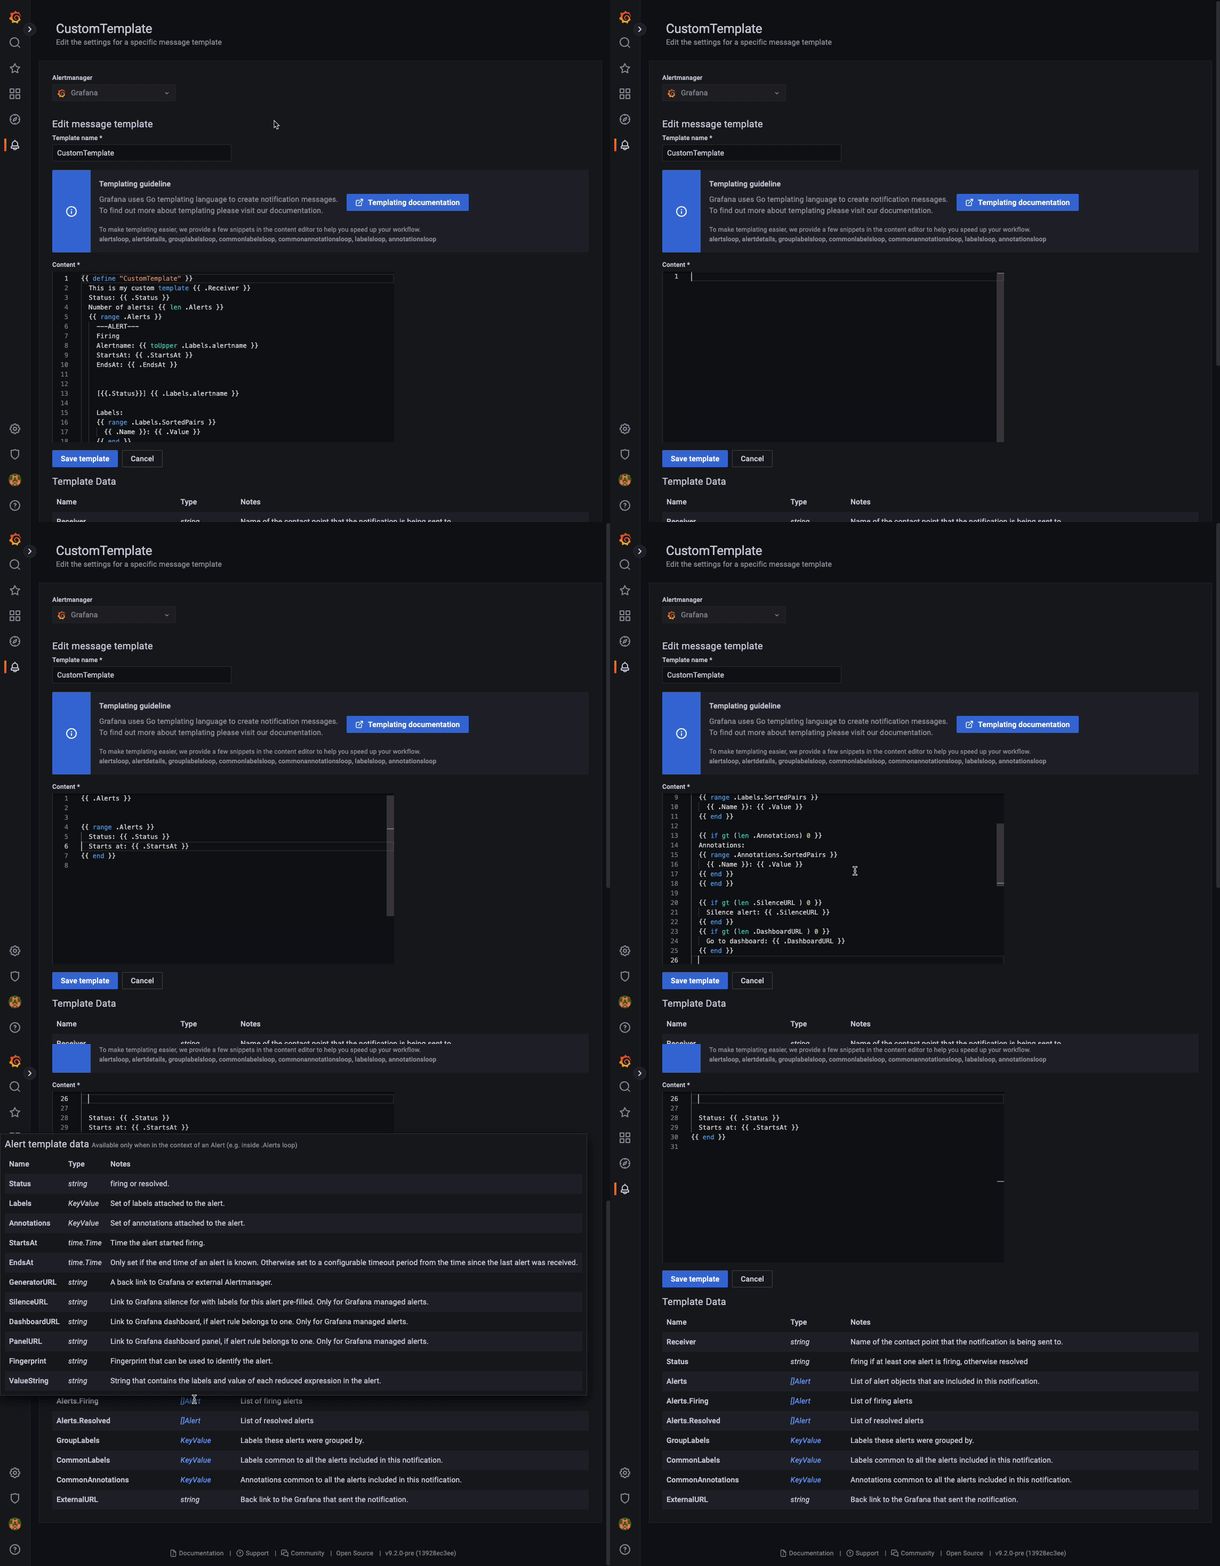
Customize alert notifications using flexible templates, enabling dynamic and adaptable alerting configurations.
Native as-code support
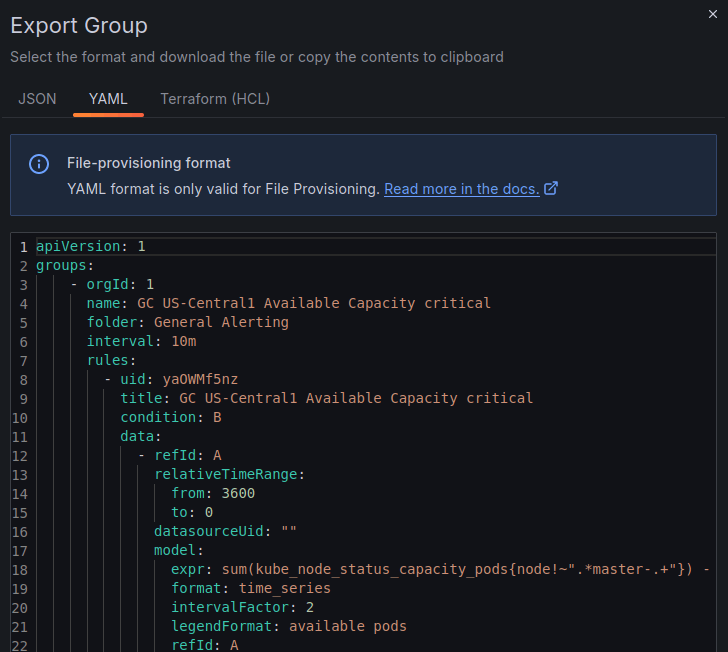
Empower developers with native support for defining alerts as code, promoting automation and version control. Grafana Alerting supports both file-based provisioning and Terraform with dedicated alerting resources. In addition, a comprehensive provisioning API enables custom automation.
Alert state history
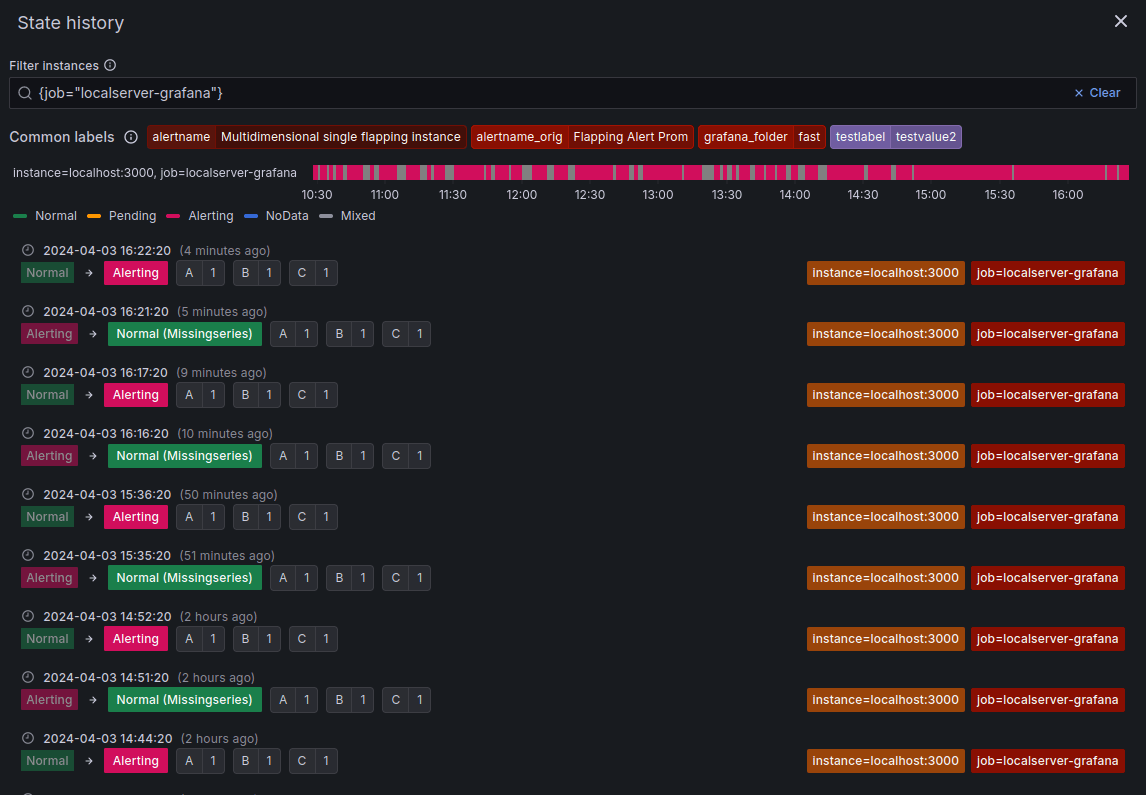
Understanding the lifecycle of alerts is crucial for effective incident management and post-incident analysis. Grafana Alerting provides robust support for alert state history, offering invaluable insights into how alerts evolve over time.
Finer-grained access control
If you are using the open source version of Grafana, Grafana Alerting is fully integrated with built-in viewer, editor, and admin roles for users, service accounts, and teams. Customize folder permissions to organize and control access to your alerting resources.
As a Grafana Enterprise or Grafana Cloud user, you are able to further exercise precise control over access to alerting features and configurations through role-based access control (RBAC), empowering you to define roles and assign permissions.
High availability modes
Maintain continuous operation of alerting services with high availability modes, minimizing downtime and ensuring reliability. Grafana provides robust redundancy options, so your alerting system remains resilient in the face of failures.

There may be some things from legacy alerting that you see missing or needs improvement, such as better integrations between alerts and dashboards. We are working on enhancing these integrations but also want to hear what other features you would like to see in the future. You can find the team in GitHub, our community forum, and in #alerting in our Grafana Labs Community Slack.
Grafana Cloud is the easiest way to get started with metrics, logs, traces, dashboards, and more. We have a generous forever-free tier and plans for every use case. Sign up for free now!

