A better Grafana OnCall: Seamless workflows with the rest of Grafana Cloud
Incident response and management (IRM) doesn’t happen in a vacuum. Your ability to respond to issues in a timely manner depends greatly on how well your on-call engineers can use their IRM tooling and observability tools together to understand what changed and why.
That’s why we’re excited about one of the more powerful benefits of Grafana OnCall: our on-call management tool integrates with all the other parts of the Grafana LGTM Stack (Loki for logs, Grafana for visualization, Tempo for traces, and Mimir for metrics) that you already love. And in recent months, we’ve been focused on creating seamless workflows between Grafana OnCall, the rest of the Grafana IRM suite, and Grafana Cloud as a whole.
In this blog, which is part of a series of posts about improvements we’ve made to Grafana OnCall, we’ll highlight some of the workflow changes we’ve made that can reduce redundancies and context switching so you can identify and respond to an incident faster.
Run Sift automatically from Grafana OnCall alert groups
You can now configure Sift, our machine-learning-powered diagnostic feature in Grafana Cloud, to run each time a new Grafana OnCall alert groups is created. In other words, automatic diagnostics are attached to each new page. Sift will check for common failure patterns by sifting through your logs, metrics, and traces associated with the alert group, reducing the time it takes your team to understand why they’re getting paged.
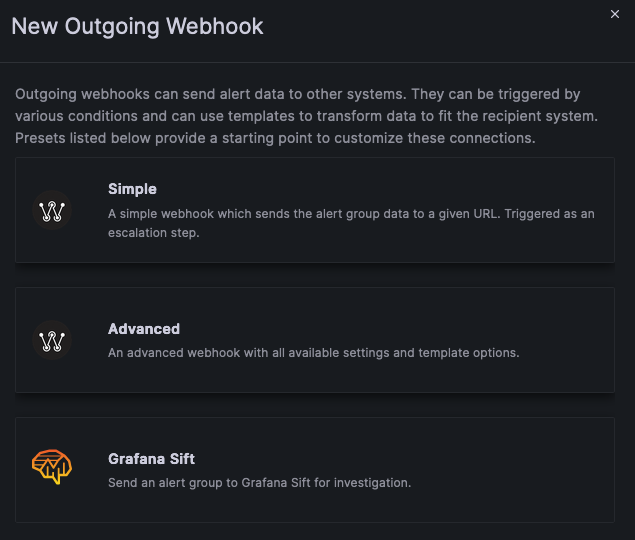
You can get this benefit through our new Sift outgoing webhook in Grafana OnCall. This webhook allows you to trigger a Sift investigation as part of an on-call escalation chain, so you can have an automatic investigation of every single alert group. Sift will even post the results back to the resolution notes of the alert group so you can see them from Slack or Grafana OnCall before you’ve even acknowledged the alert!

Note: We’ve made it easier to run Sift from dashboards and expanded the types of checks it runs. Learn more here.
Add Grafana OnCall as a contact point to Grafana Alerting
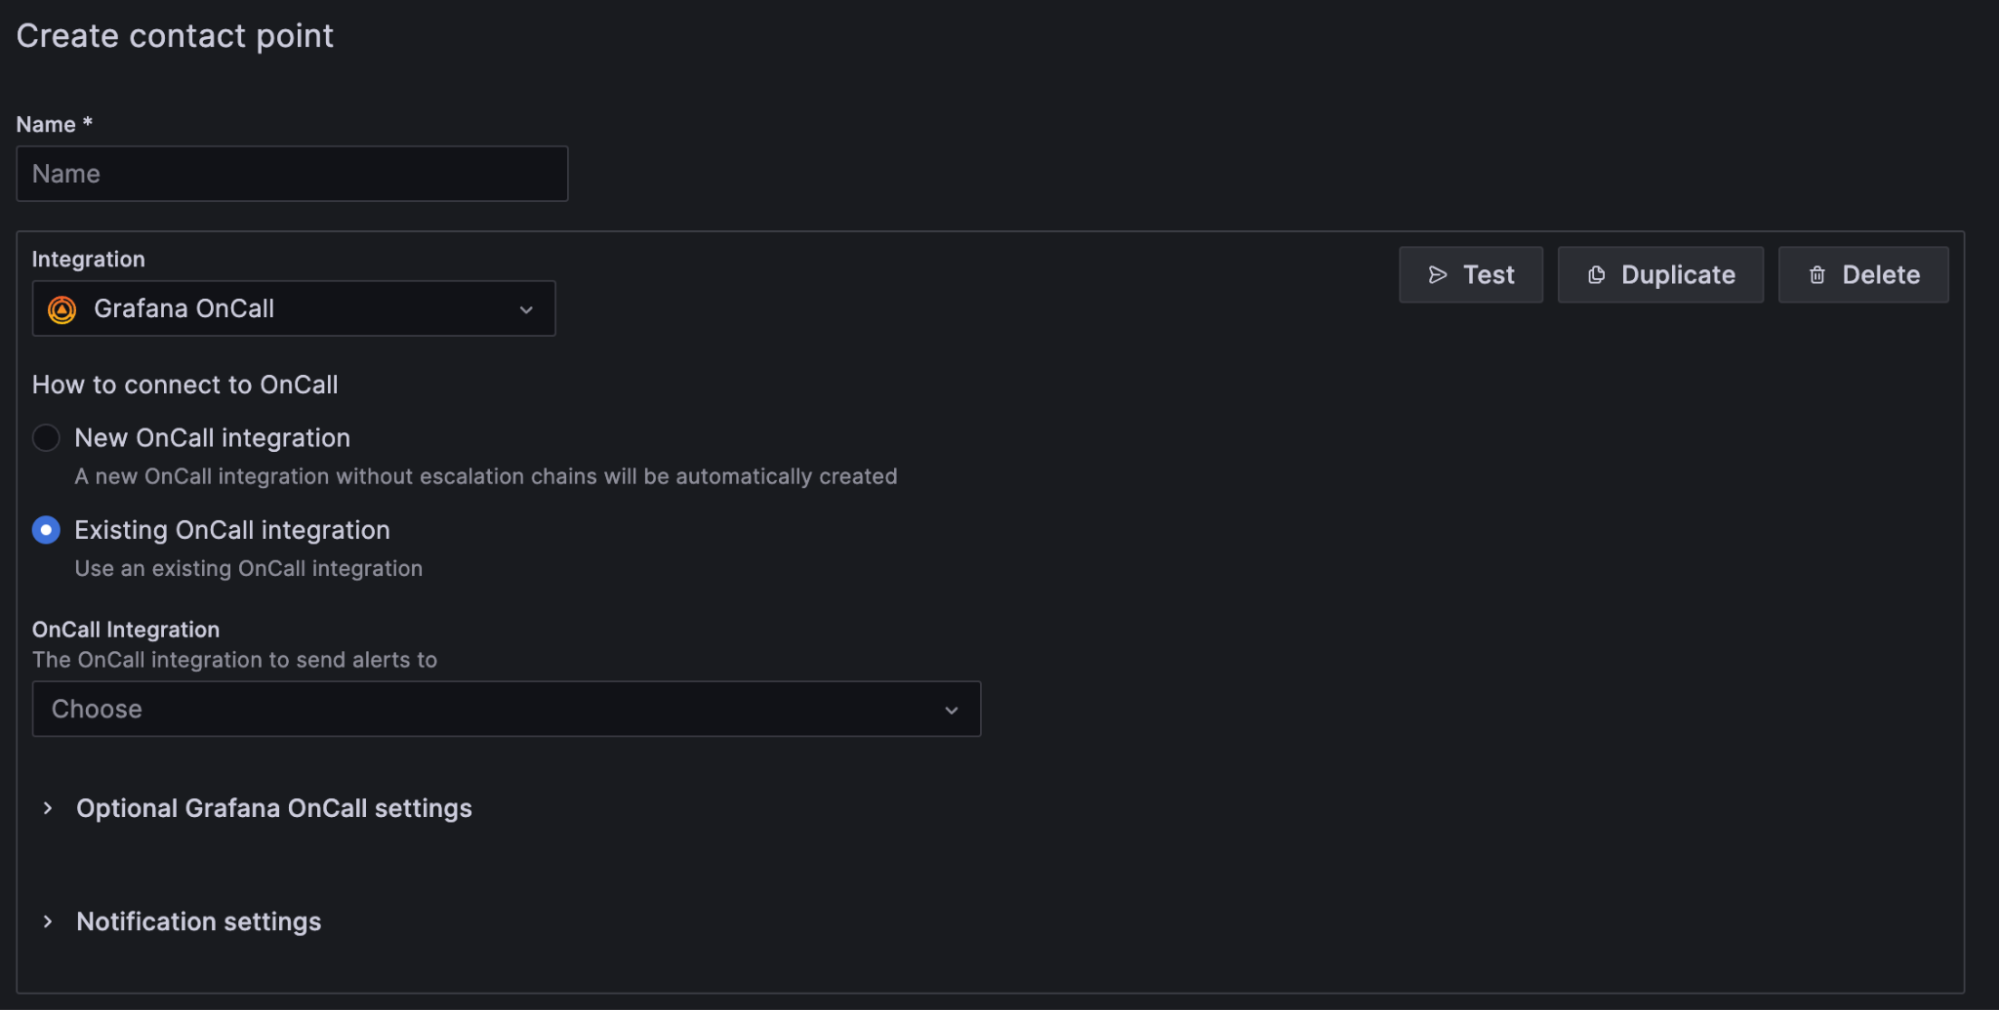
We’ve made it even easier to connect Grafana OnCall to Grafana Alerting with an improved contact point experience within Grafana Alerting. You can now see your various Grafana OnCall integrations within the contact point UI, making setup faster for your team. As you can see from the image below, simply go to Contact points in the left navigation in Grafana Alerting, then click on + Add contact point, create a name for the contact point, and select between a new and exciting Grafana OnCall integration. If you’re selecting an existing contact point, the drop-down menu will automatically populate with options to choose from.
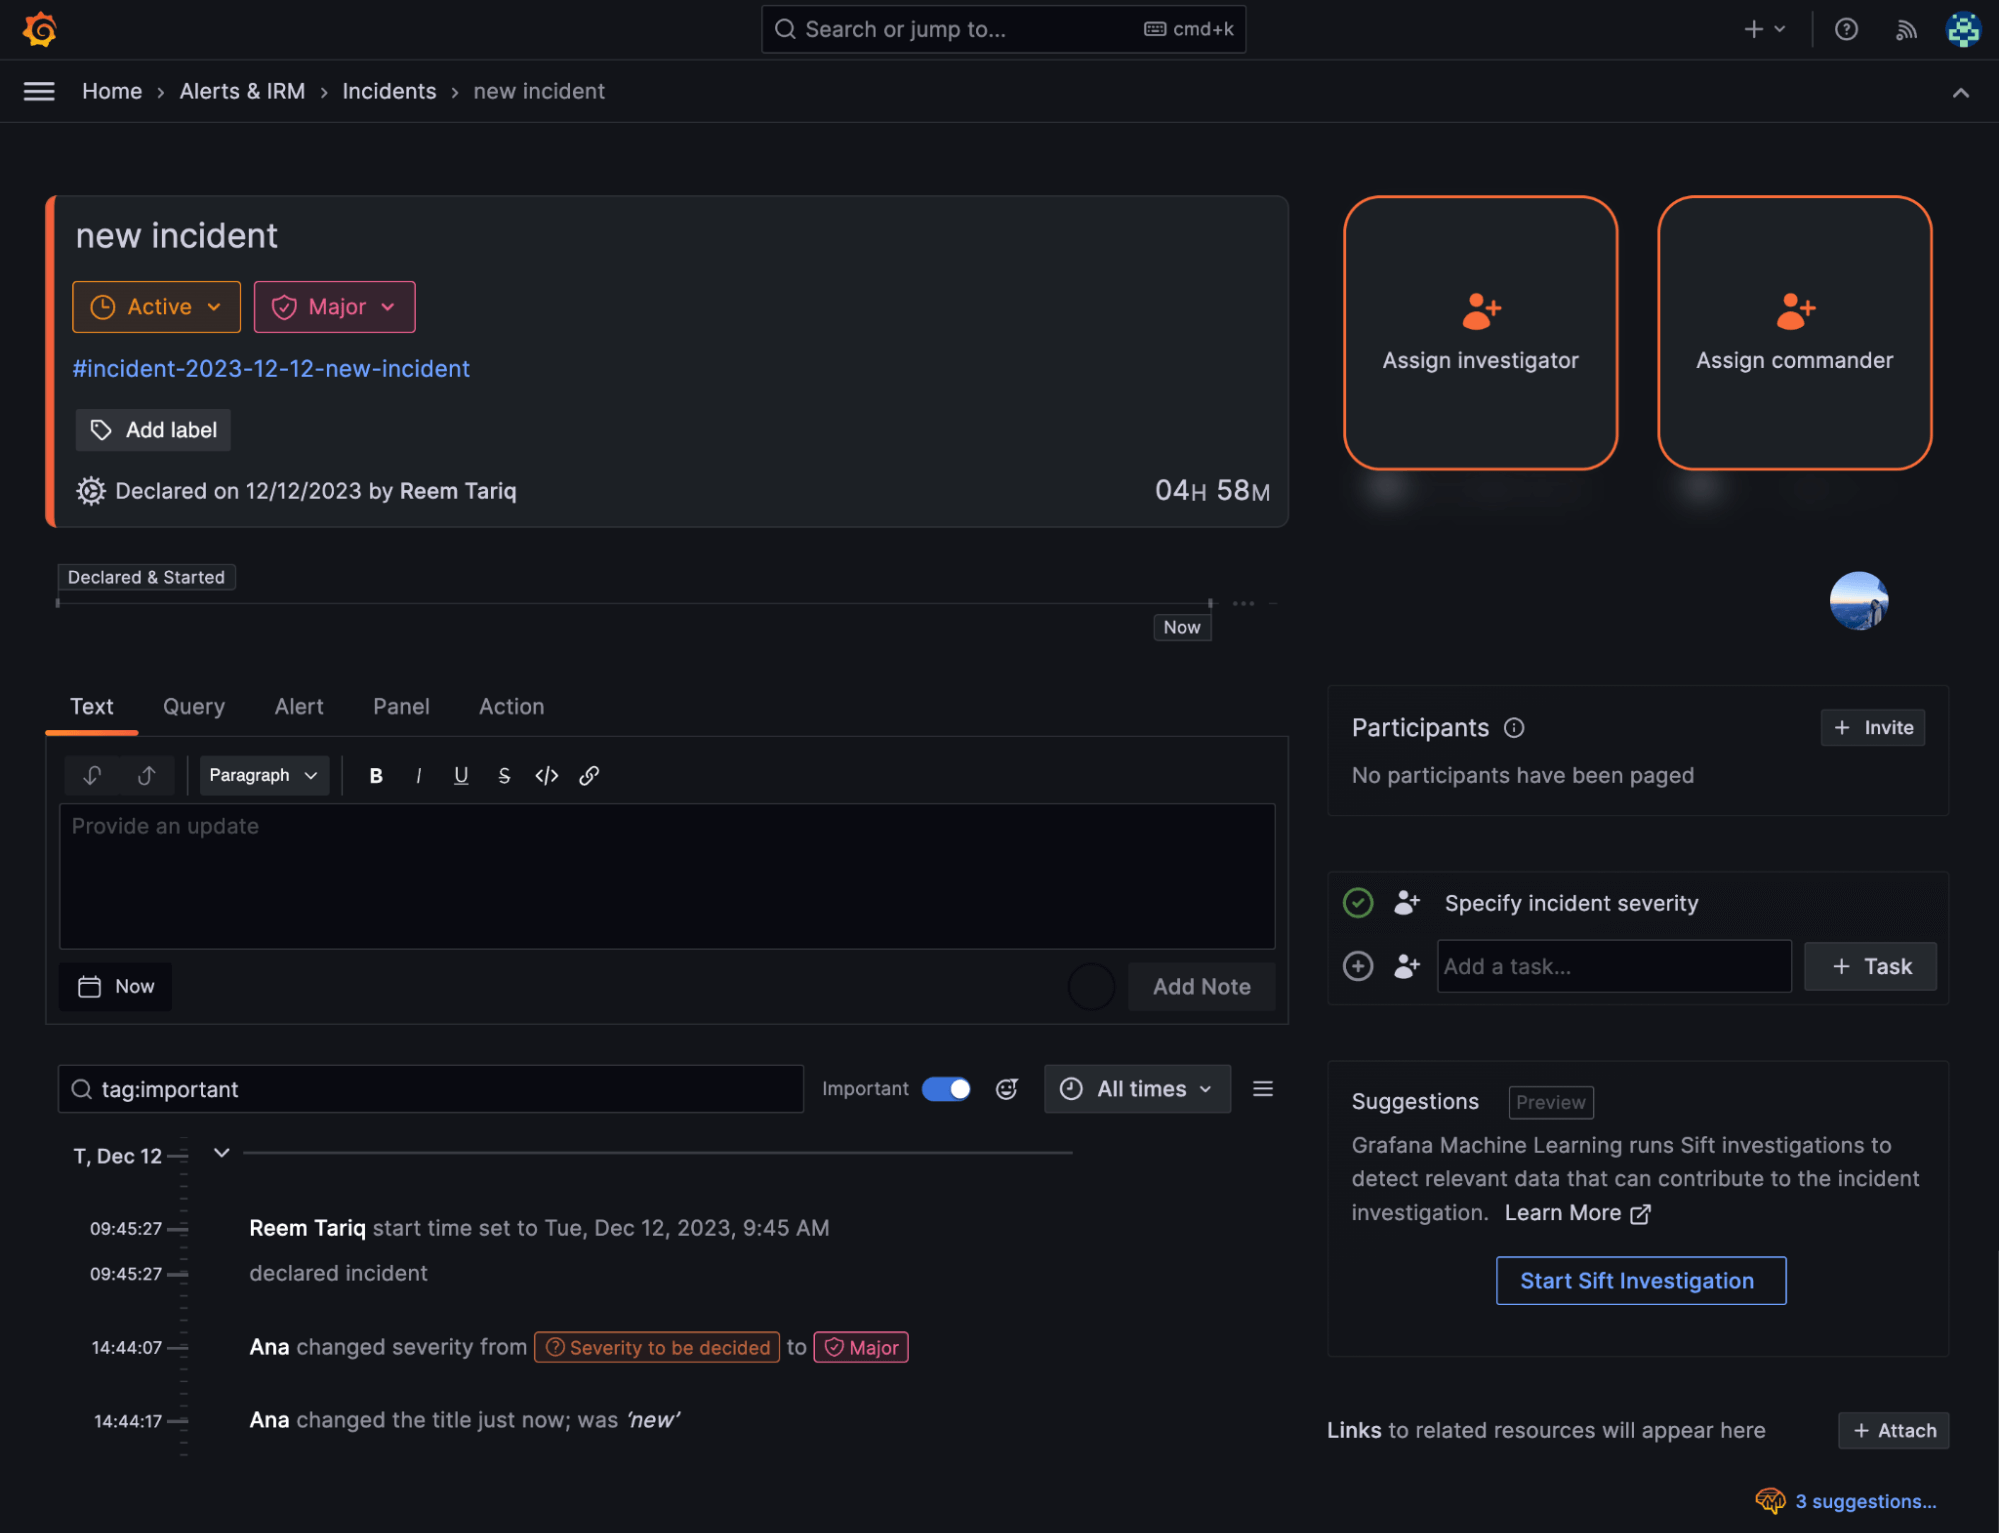
Easily declare an incident from Grafana OnCall
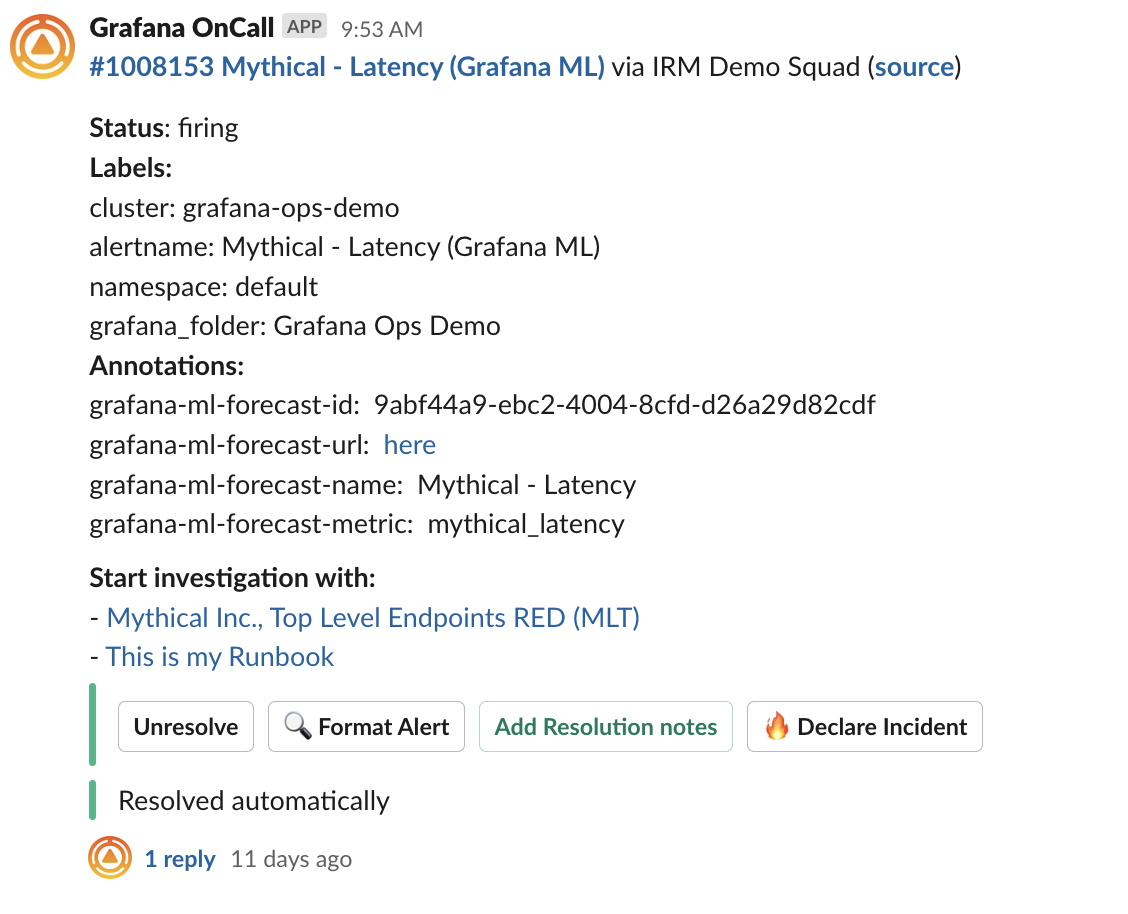
You can now use Grafana OnCall to declare an incident in Grafana Incident, including via Slack notifications from Grafana OnCall. The Grafana OnCall alert group name is automatically used as the incident name.
We continue to invest in making it easier to move quickly from notification to declaration, and from dashboard and querying to incident coordination to reduce context switching. For example, you can also now easily declare an incident from any panel within Grafana, shortening the time from investigation to declaration.
Most of the time, engineers are looking at multiple dashboards and in some cases running a few queries before they declare an incident. With this “declare an incident” workflow now available across panels and Grafana explore it because easier for you and your team to standardize your incident response workflows.

Easily add responders to an incident via Grafana OnCall
You can also page users or teams via Grafana OnCall directly from an active incident. With this new feature, participants can access the same user and team list they see across Grafana and more easily coordinate across teams by using Grafana Incident and Grafana OnCall together.
Learn more about Grafana OnCall
These are just a few of the recent improvements to Grafana OnCall. If you want to learn more, check out our companion pieces on changes we’ve made to address the user experience and operating at scale.
You can also check out our docs for more info, and watch our Incident management with Grafana IRM & SLOS in Grafana Cloud webinar to learn more about Grafana OnCall and the broader Grafana IRM offering.
Grafana Cloud is the easiest way to get started with metrics, logs, traces, and dashboards. We recently added new features to our generous forever-free tier, including access to all Enterprise plugins for three users. Plus there are plans for every use case. Sign up for free now!