CI/CD observability: Extracting DORA metrics from a CD pipeline
Last November, Dimitris and Giordano Ricci wrote a blog post about CI/CD observability that looked into ways to extract traces and metrics in order to get a better understanding of possible issues inside a CI/CD system. That post focused on getting data from a continuous integration (CI) system, and it really resonated with the community.
Based on this work, Dimitris, Horst, and Zack Zehring, as part of Grafana Labs’ latest hackathon, set out to explore how we could extend that approach outside of the CI realm and into the world of continuous delivery (CD). Our focus here was on finding ways to extract DevOps Research and Assessment (DORA) metrics from the CD workflows of some of our internal services.
The system under observation
To put this all in proper context, let’s take a quick look at the deployment we wanted to monitor. Our main goal was to explore various approaches and create a proof-of-concept for getting DORA metrics. This meant we wanted to keep the test case simple: A single service with a CI pipeline, producing a Docker image when a new commit is made on the default branch. Once the image is built, a workflow is created in Argo Workflows that pushes the image onto a staging environment. After relevant tests have been performed, a manual approval is necessary for that workflow to continue and push that same Docker image into the production environment.
While this workflow does some basic health checks, deployments always run the risk of causing an outage. Because of that, we also track any such events through Grafana Incident, where people can collaborate to get the service back online.
Why are DORA metrics interesting?
If you’re operating CI/CD pipelines (like the workflow mentioned above) you want to know how they perform. How long does it take changes to make it to production? How are we dealing with outages? How often do we introduce changes that cause failures? DORA metrics have evolved into an industry standard for helping to answer those questions and determine the effectiveness of software delivery within an organization in general. They are broadly split into three focus areas:
Velocity
- Deployment frequency: This is more of a broad metric that allows us to measure the frequency of deployments. If we deploy often it indicates that we quickly bring new features or fixes to end users. It is generally considered advantageous to have a high deployment frequency as this usually indicates smaller deliverables, which should contain fewer issues.
- Mean lead time for changes: Similar to deployment frequency, we want to deliver new features and fixes to end users quickly. This metric helps us determine how long, on average, it takes for a specific change (or commit) to make it through the various processes all the way to the production environment. The goal here is to have a short lead time.
Stability
- Change failure rate: This refers to the percentage of deployments to a production environment that lead to “failures.” Put simply, this tells us how often our updates cause real problems. A high change failure rate means less happy users. This metric helps us identify weak spots in our deployments so we can proactively act before they become real issues. Low change failure rate means our team is doing a good job validating before deployment, ensuring a smoother user experience and also adding to the general continuous improvement of our platform/product.
- Mean time to recovery: Similar to the change failure rate, this measures how quickly a team can bounce back from a production failure. It matters because the faster a problem is fixed, the less money is burned and the lower the impact to customers. At the same time, nobody likes waiting for their service to come back online. A small value in this metric keeps your users happy, but it’s more than that. It also keeps ICs and managers happy, knowing that mitigating issues is easier than ever. Of course, all this depends on good documentation and a proactive approach to addressing problems before they impact users.
The third area of focus is reliability, which broadly covers various operational aspects of a service, going beyond the deployment itself. These metrics are closely tied to service level objectives (SLOs), ensuring that the system consistently meets defined performance expectations. Due to that, we declared it out-of-scope for our hackathon project.
What we did to get the data
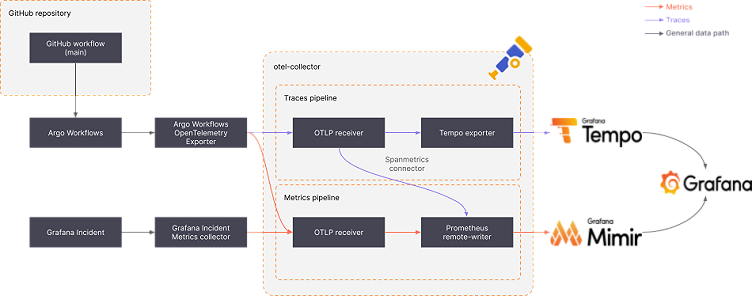
In order to get to these metrics, we created a data pipeline from Argo Workflows and Grafana Incident all the way to Grafana Tempo (for traces storage) and Grafana Mimir (for metrics storage):

To get to workflow-specific metrics, we created a small Kubernetes controller/informer that we called “Argo Workflows OTEL exporter” that monitors changes to resources managed by Argo Workflows and extracts metrics and trace data.
To get incident-related data, we created a webhook receiver for Grafana Incident that would also push metrics out.
Both data streams were then collected in an otel-collector instance, which allowed us to extract even more metrics from the collected traces without putting too much logic into the Argo Workflows OTEL exporter.
Finally, the otel-collector fed metrics and traces into Mimir and Tempo, respectively, so they could be visualized in a Grafana instance.
In the following sections we will go into further detail on how exactly these components helped us with specific metrics.
DORA metrics: velocity
Velocity metrics are all about the deployment process, focusing on the time it takes a certain piece of code to reach the production environment. As such, we implemented a tiny Kubernetes informer that watched Workflow resources created by Argo Workflows and generated OTEL metrics and traces from them when completed.
Of the two metrics listed in this category, the deployment frequency was the easier to extract: All we had to do was find out what Workflow resources were directly involved with pushing the artifact to production and capture how many were run in a specific timeframe. The following PromQL query does that for the most part:
sum(cd_argoworkflows_count_total{workflow_group="backstage"}) - min(cd_argoworkflows_count_total{workflow_group="backstage"} offset $__range)The mean lead time for changes was a bit trickier. The deployment pipeline usually doesn’t know anything about specific changes. All it cares about is taking an artifact (e.g., a Docker image), updating the configuration of the production environment to use that image, and waiting for that rollout to succeed. To get around this, we included additional metadata from GitHub into the deployment workflow that encompassed (among other things) the dates of the relevant commit(s). We then calculated the time from when that commit was created to when the workflow finished, and we pushed the result into a histogram for the lead time of the given project and queried it with something like this:
cd_argoworkflows_leadtime_sum{workflow_group="backstage"} / cd_argoworkflows_leadtime_count{workflow_group="backstage"}
These two are just pure metrics, but we also wanted to have a more detailed data set available for post-processing. To get there, the Kubernetes informer also generated a trace for every completed Workflow resource that not only included information about the workflow but also timing information about each executed step. Similar to the metrics, these traces were forwarded to our central otel-collector instance where they were processed and used to generate some additional metrics using the spanmetrics connector. Finally, the otel-collector sent the original traces, the original metrics, and the derived metrics to our Tempo and Mimir instances so they could be rendered inside a dashboard:

The dashboard presented that data in simple value panels highlighting the number of tracked workflows over a given time period. Additionally, we thought it would be useful to present links to the actual workflow traces, for which you can find a sample down below. As for the lead time to change, we presented the mean value in the dashboard alongside a 0.9 quantile to better notice outliers. Please note that the values in the screenshots are just examples collected from various test runs.

DORA metrics: stability
To calculate our stability metrics, we integrated with Grafana Incident. This gives us the power to calculate metrics based on real incidents that are caused by real-time outages happening in production environments. We implemented this by:
- Creating a Grafana Incident metrics collector, which listens for webhooks from Grafana Incident for a certain event.
- When a webhook is received, metrics are generated and pushed to an OpenTelemetry receiver, using a GRPC service.
- The OpenTelemetry receiver then pushes the metrics to Prometheus Remote-Write using Grafana Agent, and the metrics can then be displayed in our Grafana dashboard.
Here’s a small demonstration, provided through the following images:


For the change failure rate metric, we used the following query:
sum(cd_incidents_count_total{service_name="argo-workflows-otel-exporter", repo="enghub", status="active"}) / sum(cd_argoworkflows_count_total{service_name="argo-workflows-otel-exporter", workflow_group="enghub"})This is interpreted as the amount of total incidents divided by the amount of total deployments in a certain timeframe.
For the time to restore service metric, we used the Grafana Incident data source to query metrics for the service in question. We were then able to query our incidents based on the label we assigned when we initiated the incident. (Read more on how to query the data source here.) All active incidents (incidents with no time_to_resolve variable set) are marked as Pending, and resolved incidents display the actual time to resolve value.
Why use OpenTelemetry and how does it enable observability?
As we noted earlier, we used OpenTelemetry for this hackathon project. It helps with observability by offering open guidelines and tools for measuring, gathering, and moving the key parts of telemetry signals: metrics, traces, and logs. It also establishes a common method for sharing telemetry information among signals and services, and it suggests naming rules (semantic conventions) to ensure that telemetry from various apps can be easily connected and analyzed by observability tools and companies. (If you want to learn more about the role of OpenTelemetry, we recommend Daniel Gomez Blanco’s book on the subject.)
In our case, we have used Grafana, Mimir, Tempo, and Grafana Incident to extract our DORA metrics, all of which are OpenTelemetry-compatible. Similarly, we could also use other data sources for the same purpose or replace Grafana Incident. For example, we could have used something like GitLab labels to create an incident.
In fact, we believe broad adoption of CI/CD observability will likely require broader adoption of OpenTelemetry standards. This will involve creating new naming rules that fit CD processes and tweaking certain aspects of CD, especially in telemetry and monitoring, to match OpenTelemetry guidelines. Despite needing these adjustments, the benefits of better compatibility and standardized telemetry flows across CD pipelines will make the effort worthwhile.
In a world where the metrics we care for have the same meaning and conventions regardless of the tool we use for incident generation, OpenTelemetry would be vendor-agnostic and just collect the data as needed. As we said earlier, you could move from one service to another — from GitLab to GitHub, for example — and it wouldn’t make a difference since the incoming data would have the same conventions.
Looking forward
At this point this implementation is just a proof-of-concept. We think, though, that the data that we will be able to gather once we put it into production will help us optimize our deployment process for this and other internal services. Mean lead time for changes especially should help us optimize the size of deliverables, but also detect steps inside the various pipelines that take longer than strictly necessary. The stability metrics will also help us get a more holistic view of what happens to a service after its deployment and feed that knowledge back into previous steps.
From a learning perspective, this hackathon has helped onboard more folks to the topic of CI/CD observability but also showed us some gaps in the available tooling that would be very interesting to explore in the future!
Ideas for next steps
- Contribute this back to CNCF CI/CD Observability working group.
- Integrate more with logs. Get logs from Argo Workflows and Grafana Incident and make them accessible in a dashboard.
- Create a Grafana app plugin, responsible for DORA metrics.
- Make the argo-workflows-otel-exporter an actual receiver, and make it open source here.
Grafana Cloud is the easiest way to get started with metrics, logs, traces, dashboards, and more. We have a generous forever-free tier and plans for every use case. Sign up for free now!


