
How shipping/third-party logistics companies reduce MTTR and increase uptime with the Grafana LGTM Stack
These days, everything can be tracked: transportation, deliveries, food orders . . . For consumers, knowing the location of a package or courier is a bonus, but for companies in the business of shipping, delivering, and third-party logistics, it’s a necessity. And so is having the right observability system to ensure everything gets where it needs to go. After all, errors, downtime, or anything that causes delays will end up delivering unhappy customers and lost revenue.
Here, insiders from some of the world’s biggest shipping and third-party logistics (3PL) companies share how the Grafana LGTM Stack (Loki for logs, Grafana for visualization, Tempo for traces, and Mimir for metrics) has helped their teams solve issues faster and improve customer experiences.
As DHL Express Head of IT Djamel Djedi puts it: “This observability stack provides so many benefits.”
Proactive monitoring and reducing MTTR
Each year, more than 296 million packages are shipped around the world via DHL and their premium service, Time Definite International. There is very little room for downtime, false alarms, errors, and failed requests, and the IT team at DHL Express Switzerland — a local unit that provides solutions for tracking customs clearance progress, analytics, mobile and optical character recognition (OCR) scanning, and warehouse management on every package that moves through the country — realized its traditional monitoring system wasn’t enough. Because the system was siloed, the IT teams were often reactive when issues arose, which hampered how long it would take to identify and resolve them.
DHL transformed its IT and business flows with a Grafana-centric observability solution using Grafana, Grafana k6, and Prometheus. They were then able to take a proactive approach to monitoring, which was boosted by a robust implementation of Grafana dashboards and Grafana Alerting.
“Our alerts contain the name of the application, a description of the issue, a link to the Grafana dashboard, as well as a link to a wiki in Microsoft Teams containing remediation instructions,” Lead Architect Michael Lerch said. “The result? No matter who is on duty, they can quickly address issues that arise and resolve them faster than we could ever do before.”
As of 2023, the team has grown their Grafana usage to 80 alerts, 40 dashboards, and 60 active users. In the process, they have also reduced their collective daily stress. “I love arriving each morning and looking at the Grafana dashboards showing everything is OK,” Head of IT Djamel Djedid said. “You don’t need to scroll emails or hope that no one will ring or ping you — you already know.”

Learn more about DHL’s observability stack and its phased approach to implementing the Grafana stack.
Smooth customer experiences
MIllions of consumers across India rely on Blinkit, formerly known as Grofers, to have their groceries and essentials delivered. One feature that makes the company so popular? Blinkit promises that all deliveries are made in 10 minutes or less.
Customer satisfaction doesn’t only depend on the instant arrival — Blinkit needs its shoppers to have a smooth experience when they order, too. Hiccups in the checkout process can lead to abandoned carts, so issues need to be fixed quickly to prevent losing sales. After replacing its ELK Stack (“We were spending half of our time making sure everything was up and running with the ELK Stack,” said Blinkit Engineering Manager Vaibhav Krishna) with Grafana Cloud, Blinkit had continuous access to the crucial data needed to see its whole observability picture in real time.
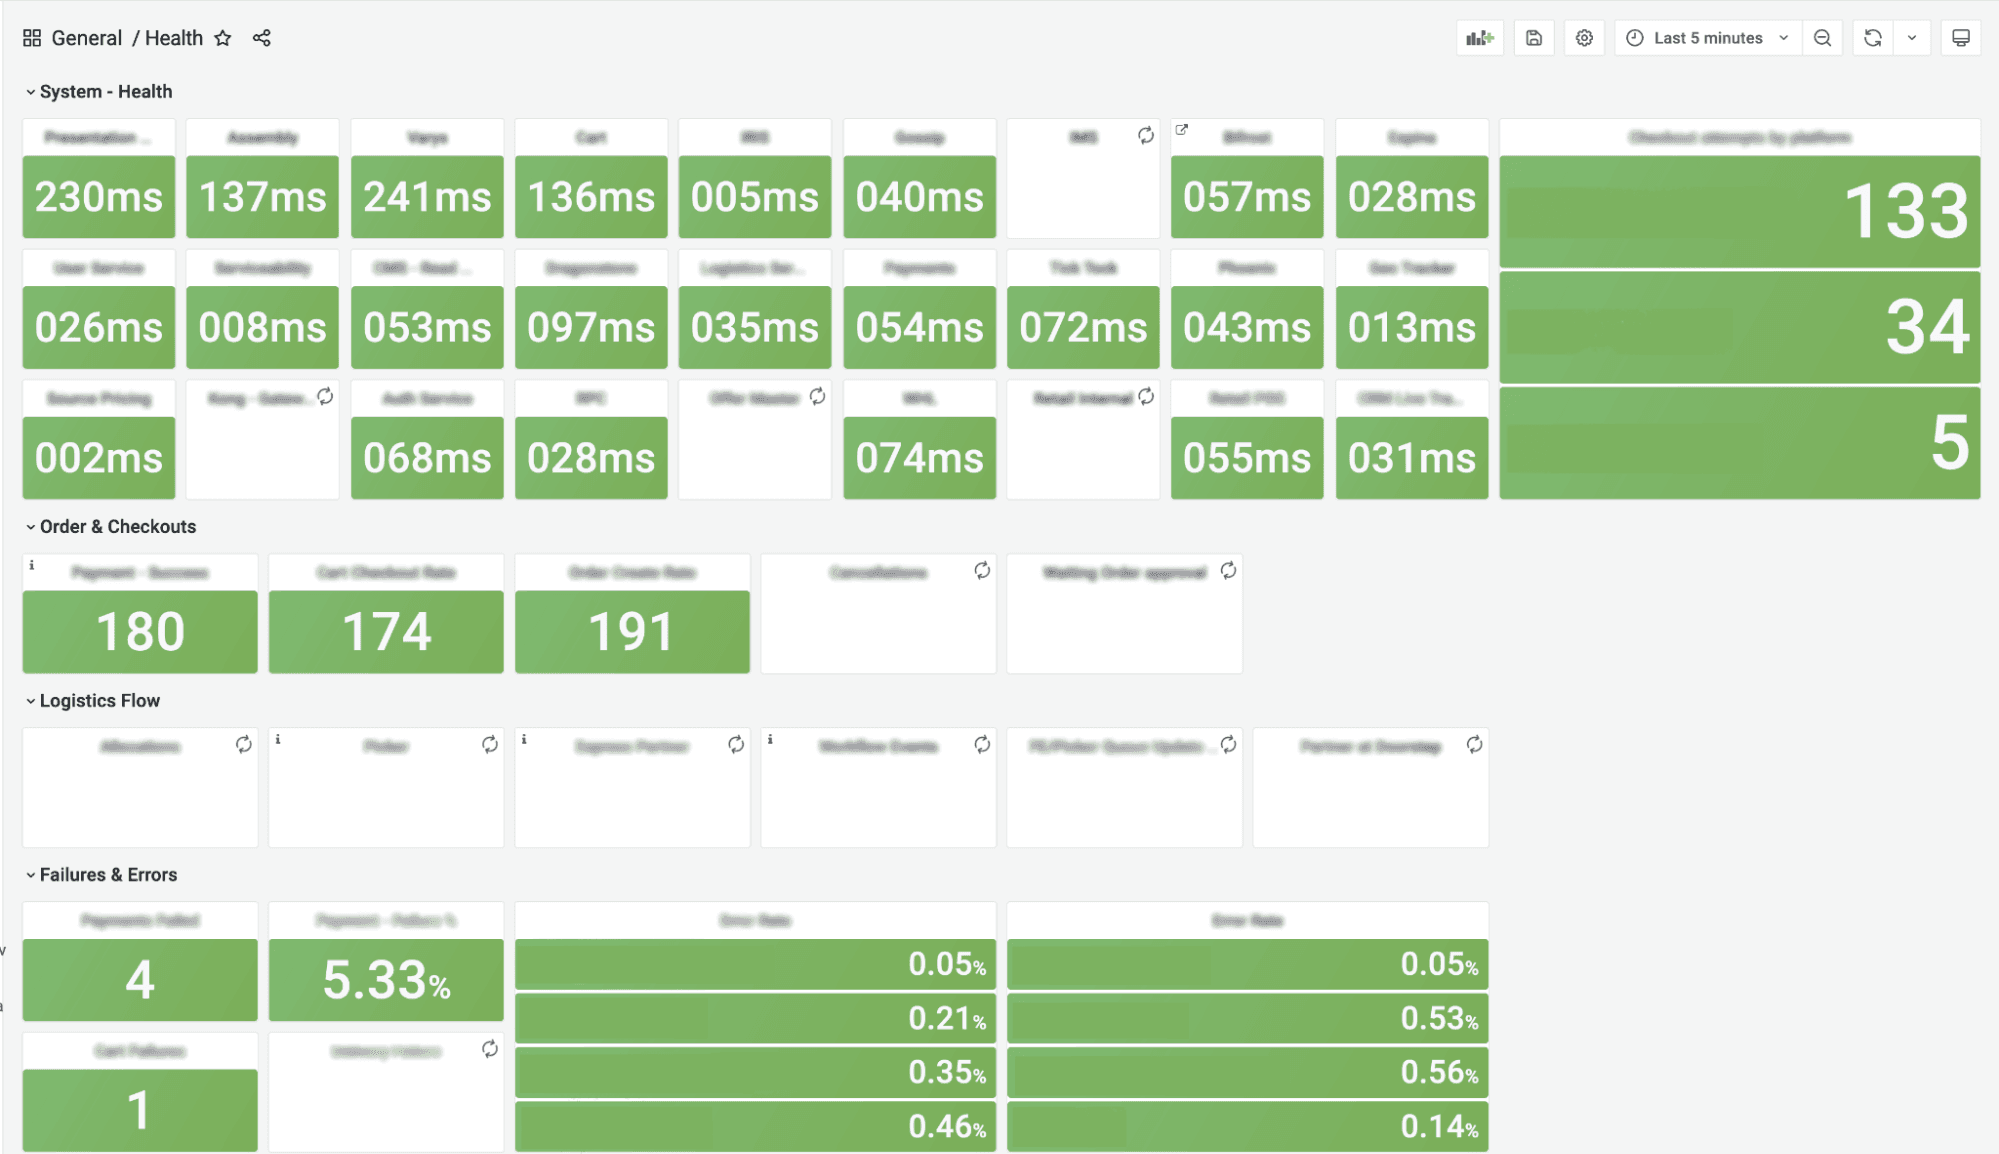
One key data source visualized in Grafana is the customer checkouts per minute, which has a direct connection to Blinkit’s customer satisfaction and loyalty metrics.
“Grafana, Grafana Loki, and Grafana Cloud help us make sure that our checkout is always functioning for our customers,” Krishna said. “If we don’t have a working checkout system, we don’t have an e-commerce platform.”
Check out how Grafana Cloud delivered on Blinkit’s observability goals.
Self-service onboarding and real user monitoring
As the leader in integrated container logistics, Maersk serves more than 100,000 customers that transport goods over oceans, ports, air, and land. In total, the company is responsible for ensuring that 20 percent of the world’s global trade is flowing smoothly.
Maersk has a large and complex infrastructure and takes a cloud-first, technology-driven approach to its business. When the company began modernizing its technology landscape, its goal was to provide more reliability, visibility, and agility to its customers. One important part of that was empowering its developers to make their own choices in technology — but it came with a downside. With no comprehensive coverage, managing the toolings and correlating data was “nearly impossible,” Maersk’s Director of Platform Engineering Roshith Radhakrishnan said.
To solve the problem, Maersk revolutionized its observability by building a centralized internal observability platform (known as MOP) using the Grafana LGTM Stack. MOP provides easy, self-service onboarding for users and democratizes observability, making data available for all users across the entire development organization.
But the team also wanted to see how features of MOP were being used and needed a frontend observability solution. With Grafana Faro, a highly configurable web SDK, Maersk was able to add real user monitoring (RUM) to its platform without additional costs or new vendor headaches. MOP now has templated (but customizable) dashboards for frontend users where they can monitor a page performance summary featuring web vitals and other metrics, such as exceptions, errors, and user analytics data.
In other words, “Grafana Labs saved us,” said Maersk’s Senior Engineering Manager for Observability Platforms, Henry Kühl.

Find out more about how Maersk uses the Grafana LGTM Stack and Faro for their platform and how it opened up the possibility of powering observability for all of their edge endpoints.
Grafana Cloud is the easiest way to get started with metrics, logs, traces, and dashboards. We have a generous forever-free tier and plans for every use case. Sign up for free now!

