
How to use HTTP APIs to send metrics and logs to Grafana Cloud
Integrating monitoring and logging into your application stack is crucial for maintaining performance, enhancing security, and streamlining troubleshooting. Grafana Cloud offers a robust solution for monitoring your applications by collecting metrics and logs using an agent, such as Grafana Agent, but there are many environments where this isn’t feasible.
In these scenarios, developers often need alternatives to traditional pull-based monitoring tools, especially in environments where infrastructure is ephemeral. In serverless architectures, for example, the compute resource is only temporarily available and might not exist when the pull request is made. Similarly, batch jobs may only run for a brief period, so pull-based tools might miss the opportunity window for pulling metrics.
The solution to this problem is to send metrics and logs directly to Grafana Cloud, which ensures developers gain real-time insights into application performance without having to worry about the limitations tied to the availability of the target system.
In this guide, we’ll showcase how developers, especially those working with serverless architectures, IoT systems, or managing batch jobs, can send metrics and logs directly to Grafana Cloud using an HTTP API.
When would you send metrics and logs using an HTTP API?
Sending metrics and logs directly through an HTTP API is not merely an alternative choice to traditional agents; it’s often a strategic choice that’s made in specific scenarios. By understanding when and why to utilize this method, you can significantly improve monitoring efficiency and system performance. Here are some of the situations where sending data via an HTTP API becomes particularly advantageous.
1. Batch jobs
An HTTP API offers a push-based approach, enabling the immediate transmission of metrics and logs upon job completion. It circumvents the limitations of scrape intervals, ensuring valuable insights aren’t missed due to timing or the lightweight nature of the batch job.
2. Serverless environments
Sending data through an HTTP API ensures each invocation of a serverless function is captured. This push-based method aligns with the serverless model, providing visibility into every execution without depending on external collectors or agents that are incompatible with serverless environments.
3. IoT devices
Direct-to-cloud data transmission via HTTP API bypasses the need for local data aggregation or processing, streamlining data collection from remote locations. It’s an effective solution for ensuring consistent and reliable data flow from devices where traditional Grafana Agent installation isn’t possible.
4. CI/CD workflows
An HTTP API can be integrated directly into CI/CD workflows, providing a mechanism to push performance metrics and logs from each build or deployment. This approach ensures monitoring is intrinsic to the development pipeline, capturing data that would otherwise be inaccessible to pull-based monitoring solutions.
Sending metrics using the HTTP API
To send metrics to Grafana Cloud, get your credentials needed for Grafana Cloud Metrics. You can find the details in the Cloud Portal.

Click on Details, and you should be able to see your Metrics User ID and Metrics URL.
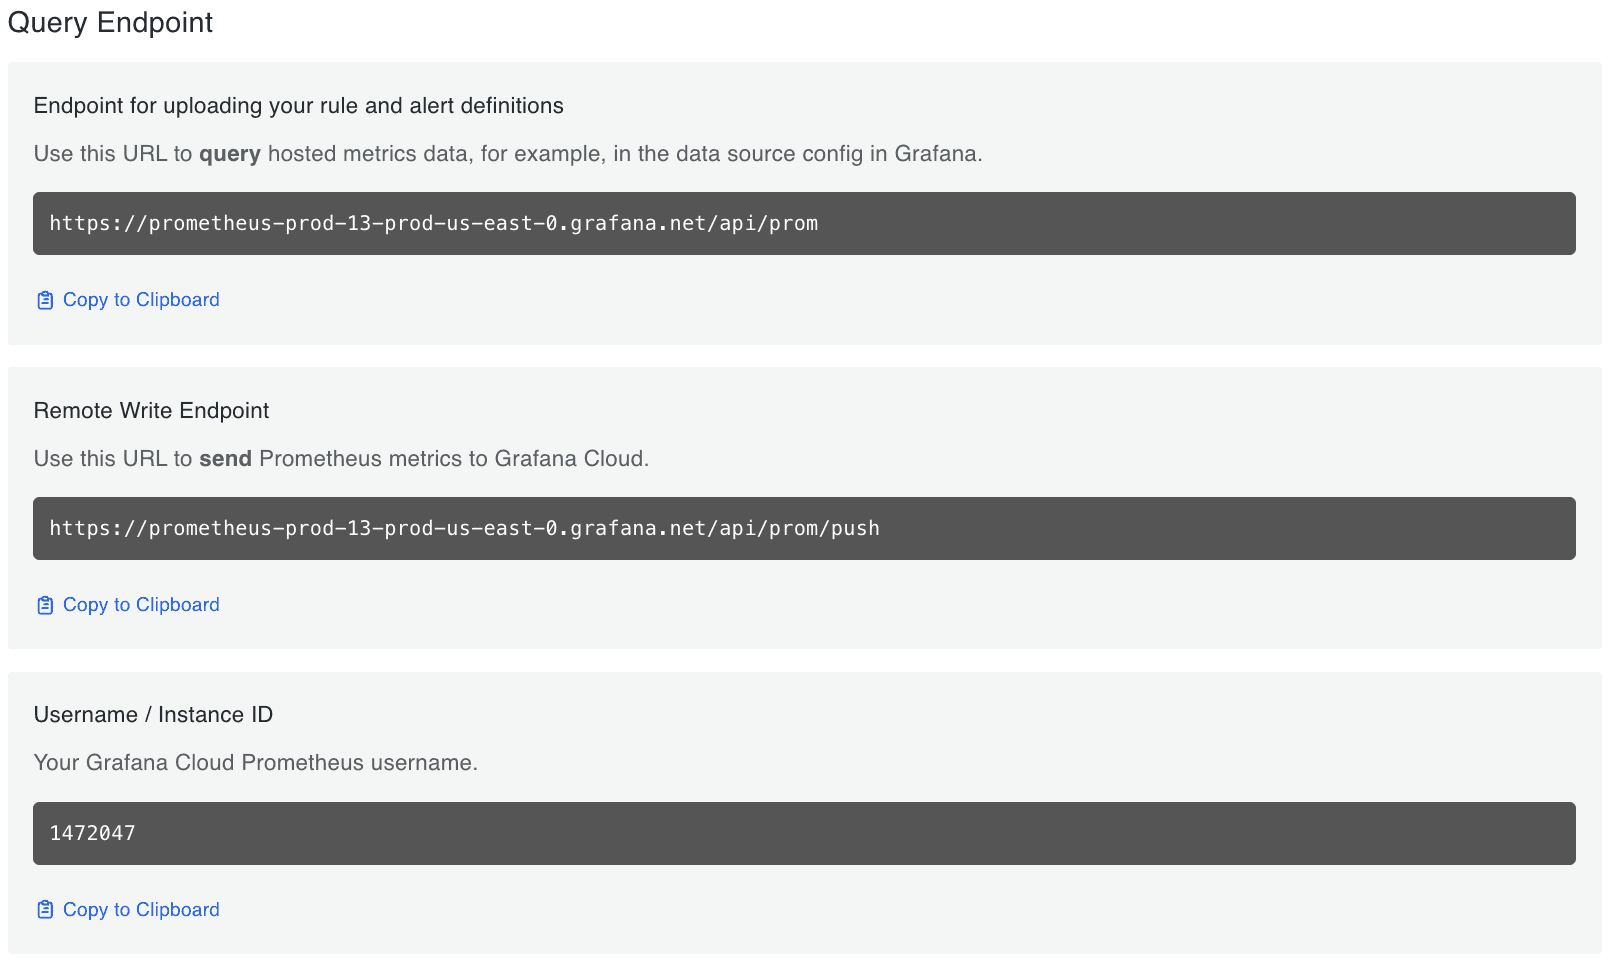
Next, you should adjust the endpoint URL based on your Prometheus card details in the Grafana Cloud portal. The general format would be replacing prometheus with influx in your endpoint and modifying the path accordingly.
Example:
Original:
https://prometheus-prod-03-prod-us-central-0.grafana.net/api/prom/pushModified:
https://influx-prod-03-prod-us-central-0.grafana.net/api/v1/push/influx/write
Refer to this doc for more information on using Influx Telegraf to push metrics to Grafana Cloud.
To simplify the process, let’s explore how to achieve this across some popular programming languages suited for the use cases discussed in this blog.
Curl
curl -X POST -H "Authorization: Bearer <METRICS_USERID>:<API_KEY>" -H "Content-Type: text/plain" "" -d "test,bar_label=abc,source=grafana_cloud_docs metric=35.2"
Note: Update <API_KEY> with your Cloud Access Token key; <METRICS_USERID> with the user ID for your Grafana Cloud Metrics instance; and <URL> with your modified metrics endpoint.
Python
import requests

response = requests.post('<URL>',
                         headers = {'Content-Type': 'text/plain'},
                         data = 'test,bar_label=abc,source=grafana_cloud_docs metric=35.2',
                         auth = ("<METRICS_USERID>", "<API_KEY>")
)
Note: Update <API_KEY> with your Cloud Access Token; <METRICS_USERID> with the user ID for your Grafana Cloud Metrics instance; and <URL> with your modified metrics endpoint.
Go
package main
import (
    "fmt"
    "bytes"
    "net/http"
 )

 func main() {
   API_KEY := "<METRICS_USERID>:<API_KEY>"
   URL := ""
     BODY := "test,bar_label=abc,source=grafana_cloud_docs metric=35.2"
     var bearer = "Bearer " + API_KEY
   var byteStr = []byte(BODY)

     req, err := http.NewRequest("POST", URL, bytes.NewBuffer(byteStr))
     req.Header.Set("Content-Type", "text/plain")
     req.Header.Set("Authorization", bearer)
     client := &http.Client{}
     resp, err := client.Do(req)

     if err != nil {
         panic(err)
     }
     defer resp.Body.Close()

     fmt.Println("response Status:", resp.Status)
     fmt.Println("body", resp.Body)
 }
Note: Update <API_KEY> with your Cloud Access Token; <METRICS_USERID> with the user ID for your Grafana Cloud Metrics instance; and <URL> with your modified metrics endpoint.
Sending logs using the HTTP API
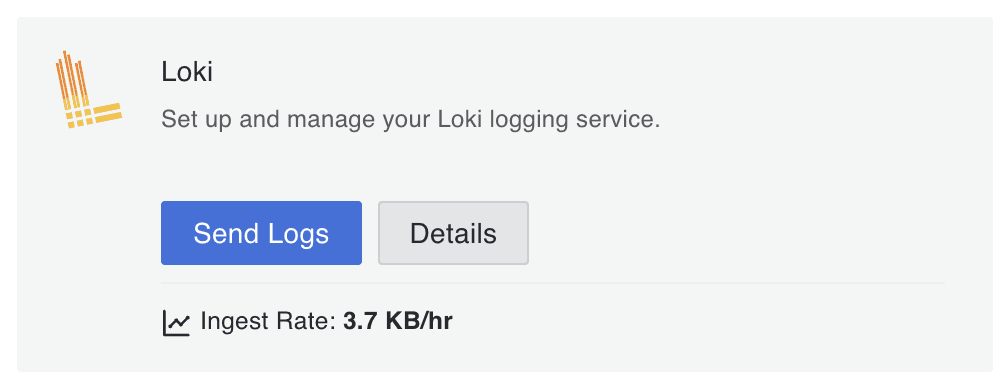
You can send logs to Grafana Cloud Logs using Grafana Loki’s HTTP API. (Grafana Cloud Logs is powered by Loki.). The process is straightforward and involves posting JSON payloads representing your log entries.
To get your credentials needed for Grafana Cloud Logs, You can find the details in the Cloud Portal.
Curl
curl -X POST -H "Content-Type: application/json" -H "Authorization: Bearer <LOGS_USERID>:<API_KEY>" -d '{"streams": [{"stream": {"Language": "Curl", "source": "Shell"},"values": [["'"$(($(date +%s)*1000000000))"'", "This is my log line"]]}]}'
Note: Update <API_KEY> with your Cloud Access Token; <LOGS_USERID> with the user ID for your Grafana Cloud Logs instance; and <URL> with your logs endpoint.
Python
import requests
import time


logs = {"streams": [{"stream": {"Language": "Python", "source": "Code"}, "values": [[str(int(time.time()) * 1000000000), "This is my log line", ]]}]}


requests.post(url = "<URL>",
              auth=("<LOGS_USERID>", "<API_KEY>"),
              json=logs,
              headers={"Content-Type": "application/json"},
)
Note: Update <API_KEY> with your Cloud Access Token; <LOGS_USERID> with the user ID for your Grafana Cloud Logs instance; and <URL> with your logs endpoint.
Go
package main

import (
  "bytes"
  "net/http"
  "fmt"
  "strconv"
  "time"
)

func main() {
  logs := []byte(fmt.Sprintf("{"streams": [{"stream": {"Language": "Go", "source": "Code" }, "values": [["%s", "This is my log line"]]}]}", strconv.FormatInt(time.Now().UnixNano(), 10)))

  http.Post("https://<LOGS_USERID>:<API_KEY>@", "application/json", bytes.NewBuffer(logs))
}
Note: Update <API_KEY> with your Cloud Access Token; <LOGS_USERID> with the user ID for your Grafana Cloud Logs instance; and <URL> with your logs endpoint.
Logging Library
npm i @miketako3/cloki
Add the logger to your application and start pushing logs to Grafana Cloud!
  import {Cloki} from '@miketako3/cloki'

  const logger = getLokiLogger({
    lokiHost: ,
    lokiUser: <LOGS_USERID>,
    lokiToken: "<API_KEY>"
  });

  await logger.info({message: "Hello World!"});

  await logger.error({message: "Hello World!", error: error});

  // with additional labels
  await logger.info({message: "Hello World!"}, {foo: "bar"});
Note: Update <API_KEY> with your Cloud Access Token; <LOGS_USERID> with the user ID for your Grafana Cloud Logs instance; and <URL> with your logs endpoint.
When should you not use this method?
While the direct HTTP API for sending metrics and logs to Grafana Cloud offers valuable flexibility for serverless architectures, batch jobs, and IoT environments, it’s not a one-size-fits-all solution. If your environment allows for the steady deployment of agents or the use of Prometheus’ pull-based system, these traditional tools may provide a more comprehensive monitoring solution, leveraging their broader feature set and scalability and are more efficient for stable, long-running systems with complex observability requirements.
Next steps
To further advance your monitoring and logging practices, explore utilizing the HTTP Metrics or HTTP Logs connections available within your Grafana Cloud instance. These connections are designed to enhance your observability strategy by providing a more detailed and comprehensive view of your system’s health and performance.
By engaging with these connections, you’ll take a significant step toward achieving complete observability in a manner that’s not only powerful but also simplistic and approachable for teams of all sizes. It will also keep the conversation going and help set the stage for more informed decision-making and streamlined operational workflows.
Grafana Cloud is the easiest way to get started with metrics, logs, traces, dashboards, and more. We have a generous forever-free tier and plans for every use case. Sign up for free now!

