5 key takeaways from the Grafana Labs' 2024 Observability Survey
Regardless of the industry they operate in or the number of people they employ, businesses with mature observability practices can respond to incidents faster — and save time and money in the process, according to the second annual Grafana Labs Observability Survey.
Organizations are making observability a critical part of their software development lifecycles as they grapple with the complexity of modern applications. However, this year’s survey makes it clear that not everyone is at the same stage of adoption, with teams that are further behind struggling to keep up with the always-on demands of today’s users.
More than 300 observability practitioners participated in the survey. They shared their thoughts on a wide range of topics, including the varying degrees of maturity, the sheer volume of tools in use, the lingering concerns about expenses, and the ubiquity of open source tools in this still-emerging market.
Key takeaways from the Grafana Labs Observability Survey
You can read the full survey to learn what respondents had to say about these topics and more, but for a quick assessment on the state of observability, here are the five key takeaways from the survey.
Observability practices are still maturing
We gauged where respondents are in their journeys by asking how they approach observability. A little over half say their organization has taken a proactive approach, which points to the growth in this space. However, organizations are still more likely to be reactive than systematic, which means they often hear about problems from their customers rather than have systems in place to address issues before their users ever find out.
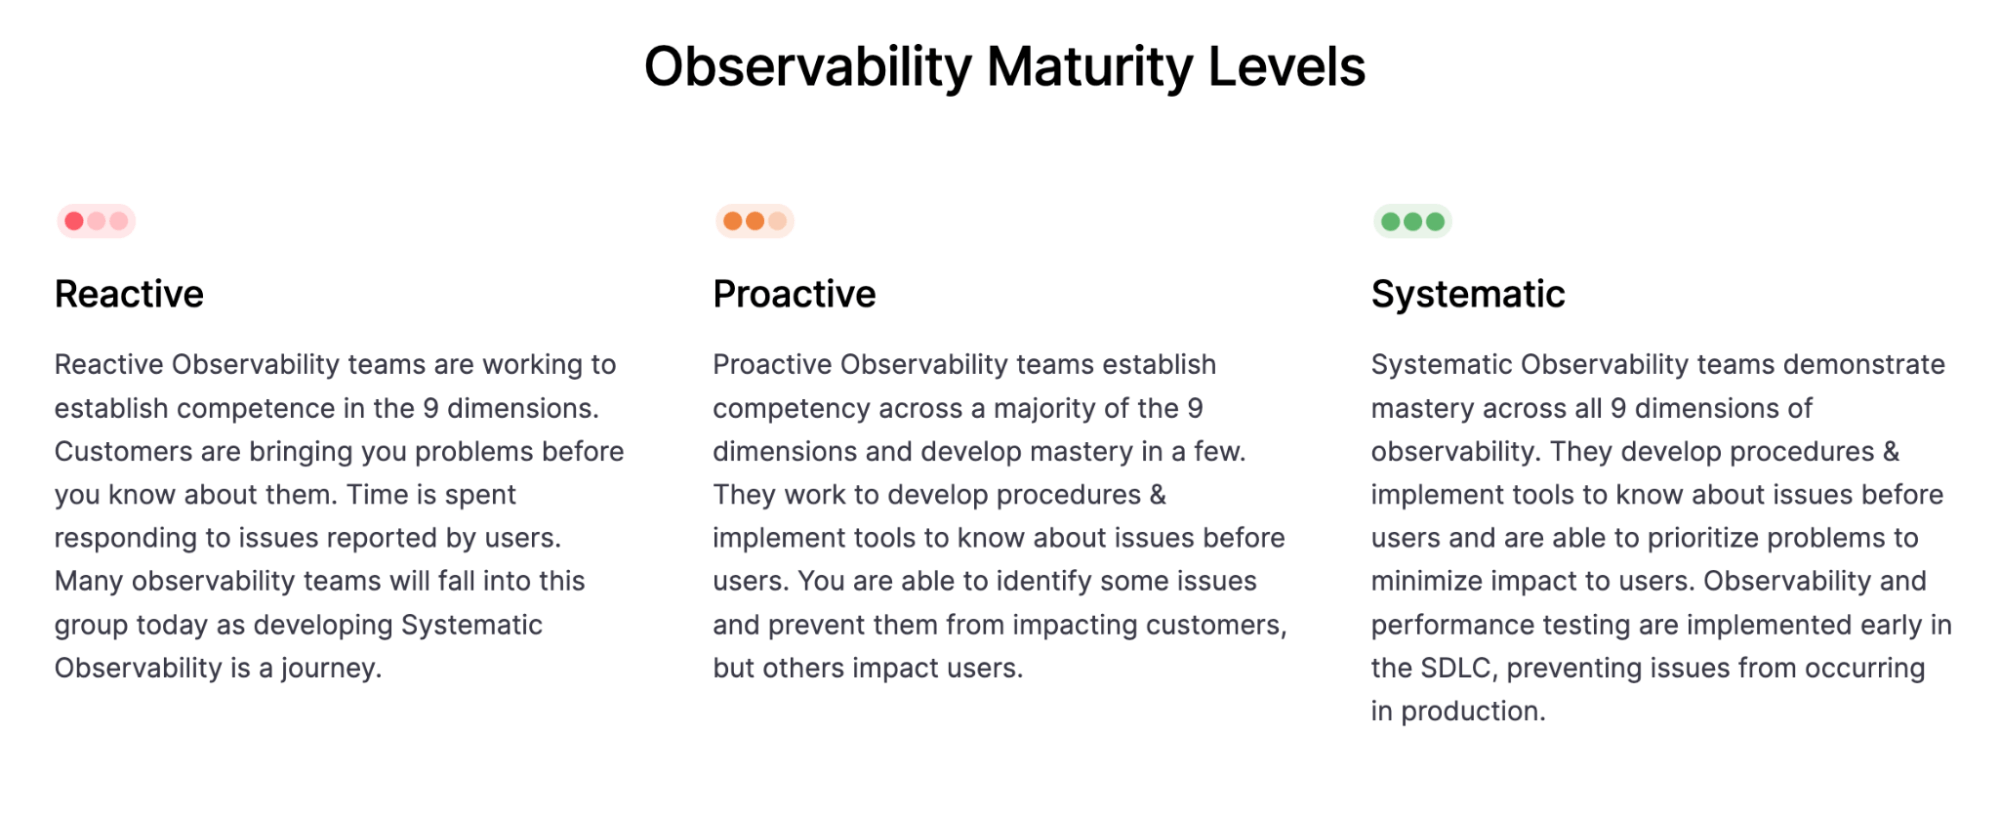
(Check out our Observability Journey Maturity Model for more on these designations.)
And the different approaches can result in very different outcomes, with 65% of those with a systematic approach having saved time or money through centralized observability, compared to just 35% of those who take a reactive approach.
Tool and data sprawl remains a major hurdle
More than two-thirds of teams use at least four observability technologies, with respondents collectively citing more than 60 technologies currently in use. In addition, half of Grafana users say they have at least six different data sources configured and actively in use in Grafana.
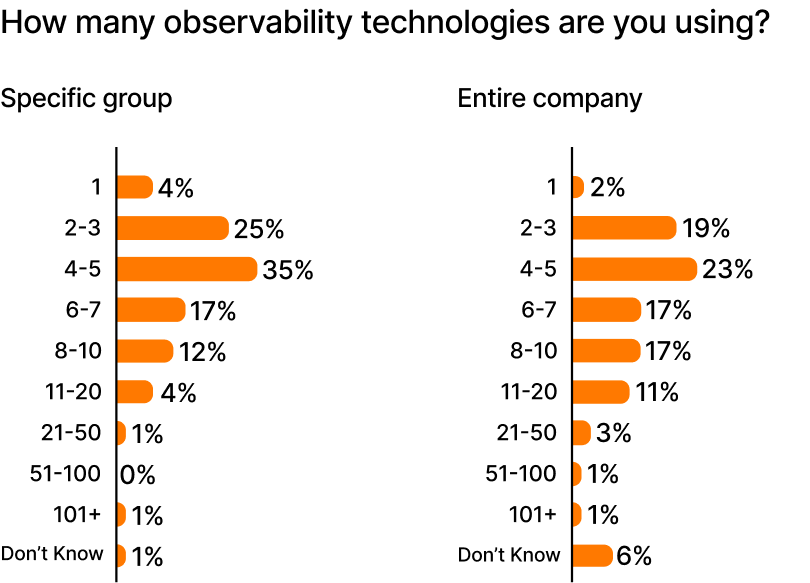
This can translate to considerable complexity and overhead, and the bigger the company, the more tools and data sources they have. It’s no wonder that among teams that have centralized observability, 79% say it has saved them time or money as a result.
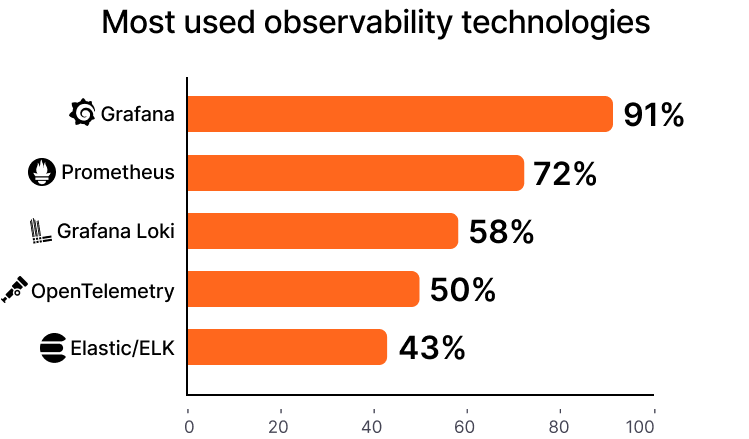
Open source is the de facto standard
We cater to a vibrant open source community at Grafana Labs. And while that likely skews the results in our survey, there’s no denying the impact of OSS. Eight of the 10 most popular technologies cited in our survey are open source, while an overwhelming majority of respondents are investing in Prometheus (89%) or OpenTelemetry (85%).
Interestingly, there’s considerable overlap between the Prometheus and OpenTelemetry communities. Almost 40% of respondents use both in their operations, and more than 50% increased their usage of each project over the past year.
AI could play a big role — eventually
AI is getting tons of attention these days, but its role in observability is largely aspirational today. Still, observability practitioners remain excited about its potential to accelerate incident response and simplify observability adoption.
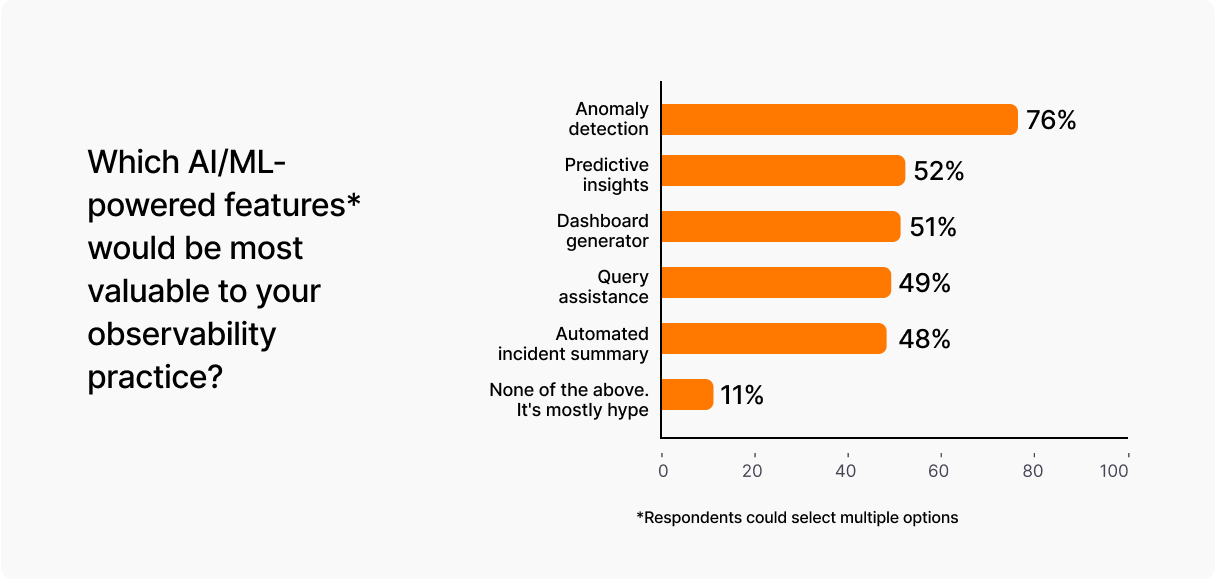
Anomaly detection is the most cited AI-enabled feature respondents say they would like to see, with more than three-quarters calling it out. Other top wish-list items for AI include predictive analytics and dashboard generation.
Cost emerges as a top concern
More than half of respondents say cost is their biggest concern about observability, while other related topics — cardinality, unpredictable bills, and vendor lock-in — are also cited.

Check out the rest of the survey results
We want to thank everyone who participated in this survey. It was conducted by Grafana Labs and was promoted on our website, blog, and in our community, so it’s not surprising that so many people who took the survey use Grafana. If you want to learn more about the topics discussed here, there’s plenty more to dig through. You’ll also find stats and analysis on the most popular technologies and the observability topics the industry is most excited about.
Grafana Cloud is the easiest way to get started with metrics, logs, traces, dashboards, and more. We have a generous forever-free tier and plans for every use case. Sign up for free now!