
How to use PGO and Grafana Pyroscope to optimize Go applications
Profile-guided optimization (PGO) is a compiler feature that uses runtime profiling data to optimize code. Now fully integrated in Go 1.21+, PGO is a powerful tool to boost application performance — and with Grafana Pyroscope, our open source continuous profiling database, you can significantly magnify the value of PGO.
In this post, we’ll explore what PGO is, how the Pyroscope team has used it internally to improve performance, and how you can use PGO to make your own programs faster.
An overview of PGO
The PGO compiler feature was initially introduced as a preview in Go 1.20, and is now enabled by default in Go 1.21. PGO enhances performance primarily through two mechanisms:
- Inlining hot (frequently executed) methods
- Devirtualization of interface calls
Let’s take a closer look at each.
Inlining
Inlining is a key optimization technique used in Go where the compiler replaces a function call with the function’s body itself. This process, informed by runtime profiling data, eliminates the overhead of the function call to allow for further optimizations. Inlining is particularly effective for frequently called functions.
An example in golang can help illustrate the inlining concept. (Note: the below example is simple, so the compiler would actually perform inlining automatically. However, PGO enables this functionality for more complex code, where inlining does not happen automatically).
Here’s an example of code without inlining:
package main

import "fmt"

// Function to add two integers; this might be inlined automatically by the compiler
func add(a int, b int) int {
    return a + b
}

func main() {
    x := 5
    y := 6

    // Function call, a candidate for inlining
    result := add(x, y)

    fmt.Println("Result:", result)
}
Without inlining, every call to add incurs some overhead due to the function’s “prologue” and “epilogue,” which are the code segments that prepare the environment for the function’s execution and clean up, respectively. With every function call, there is a prologue and an epilogue that will consume some resources.
With PGO, if add is identified as a frequently called function, the compiler can inline it to avoid this overhead:
package main

import "fmt"

// No separate function for add()

func main() {
    x := 5
    y := 6

    // Function body is inlined into the main function
    result := x + y

    fmt.Println("Result:", result)
}
Here’s a side-by-side diff comparison of the code, exhibiting the inlining:

When humans write code, it often makes sense to write it in a way that’s human-readable, but by the time the code gets the compiler, it doesn’t care about readability and thus can take advantage of inlining functions without that restriction. Put differently, the compiler can eliminate some of the inefficiencies that are introduced during attempts to make code more readable and maintainable.
In the example below, inlining transforms a flame graph with several layers — timeTravel(), setDate(), and go() — each with their own prologue and epilogue, into a single layer where the calls are combined: timeTravel(setDate(go())). This again demonstrates how inlining reduces the repeated overhead of prologues and epilogues.
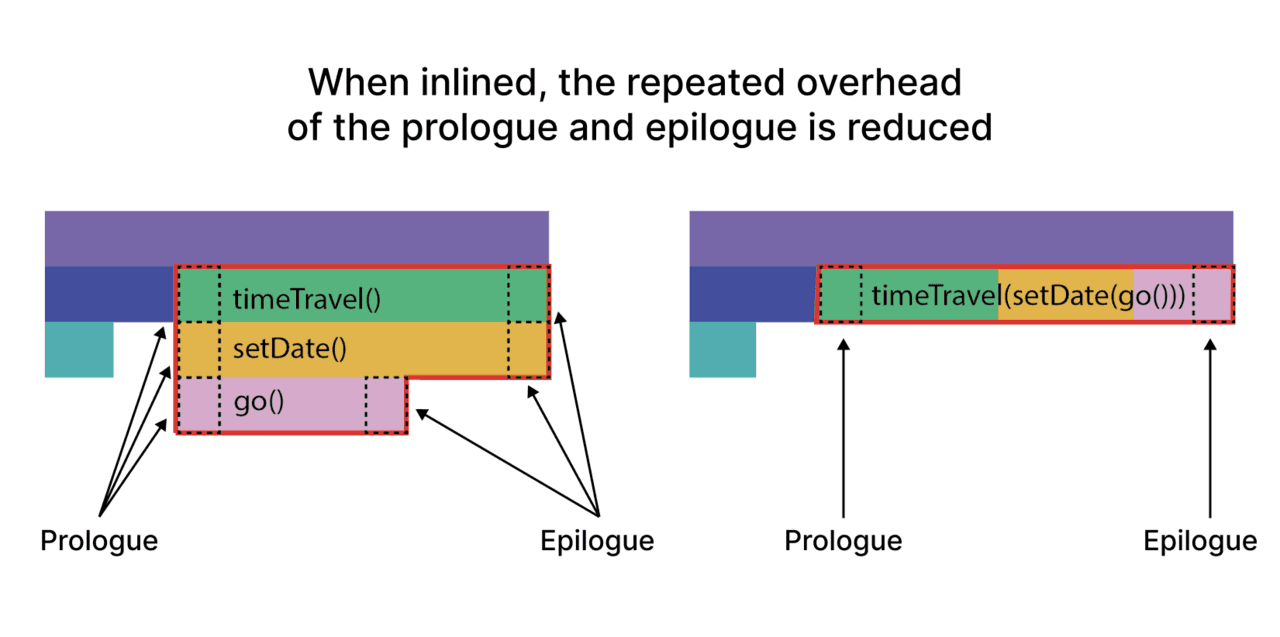
There is one important thing to note: while the inlining concept is visually represented here for clarity, the actual inlining process happens during compilation, without altering the source code. The real effect of inlining is observable in the optimized binary or the generated assembly code, where the function call overhead is eliminated, improving the execution efficiency of the program.
Devirtualization
Devirtualization is when the compiler optimizes interface calls to direct function calls. When runtime profiling is available, the compiler can better predict which concrete implementation will be called, reducing overhead and enabling further optimizations, similar to inlining.
Consider a Go example:
package main

type Greeter interface {
    Greet() string
}

type Friendly struct{}

func (Friendly) Greet() string {
    return "Hello!"
}

func greet(g Greeter) {
    _ = g.Greet()
}

func main() {
    f := Friendly{}
    greet(f)
}
Initially, greet makes an interface call to Greet. With PGO, if profiling indicates Friendly.Greet is frequently used, the compiler might directly call Friendly.Greet instead of using the interface, improving performance:
func greet(g Greeter) {
    if f, ok := g.(Friendly); ok {
        _ = f.Greet() // Direct call
    } else {
        _ = g.Greet() // Original interface call
    }
}
This simplified process shows how devirtualization makes your code faster by replacing general interface calls with specific, direct calls, when possible, based on real usage patterns observed during runtime.
The primary purpose of devirtualization is to enable direct call inlining, which in turn facilitates other compiler optimizations, such as dead code elimination and bounds check elimination.
How to use PGO with Pyroscope in Go
The process to use PGO with Pyroscope in Go consists of 4 steps:
- Build the initial Go binary with profiling enabled
- Collect runtime profiles from production
- Query for the optimal PGO data file with Pyroscope’s profilecli
- Apply and verify the PGO file
If you would like to see a working example of an application using PGO you can visit our PGO example in the Pyroscope repo.
Build the initial Go binary with profiling enabled
Begin by constructing your Go binary with profiling hooks included. This initial build doesn’t include PGO enhancements but lays the groundwork to collect valuable runtime data.
go build ./…
Collect runtime profiles from production
The best source of profile data is your application’s production environment. Use Pyroscope’s grafana/pyroscope-go (which extends pprof) to collect profiles and send them to Grafana Cloud Profiles or your local Pyroscope server.
Query for the optimal PGO data file with Pyroscope’s profilecli
The success of PGO relies heavily on the quality and relevance of your profiling data (exposed through profilecli) . Pyroscope’s profilecli tool empowers you to hone in on specific performance data that truly matters.
By filtering down to workloads from recent timeframes or particular application labels, you can exclude obsolete data from past builds. This flexible and targeted selection process ensures that your PGO file reflects the current state of your application, leading to more accurate and effective optimizations.
Here’s how you can use profilecli to generate a fine-tuned PGO file:
profilecli query merge \
    --query='{service_name="ride-sharing-app"}' \
    --profile-type="process_cpu:cpu:nanoseconds:cpu:nanoseconds" \
    --from="now-5m" \
    --to="now" \
    --output=pprof=./default.pgo
By leveraging the sophisticated query capabilities of Pyroscope, you create a PGO file that is a precise representation of your application’s current performance landscape, paving the way for substantial optimization.
Apply and verify the PGO file
Finally to apply the PGO file to your application simply provide the -pgo flag with the build command:
go build -pgo=./default.pgo
go version -m main  # Verify PGO file application
Commit the .pgo file to your source control for consistent, reproducible builds. For custom scenarios, use the -pgo flag to tailor the build.
Note: you can also see the process above in our PGO example in the Pyroscope GitHub repo.
Real-world benefits of PGO in Go
The Go team’s PGO doc mentions that benchmarks for a representative set of Go programs show that building with PGO improves performance by 2-7%, as of Go 1.21. Performance gains are also expected to increase over time, as additional optimizations take advantage of PGO in future versions of Go.
Internally, we’ve found low-hanging fruit of 2-5% performance improvements, which are easily measurable in our diff view:
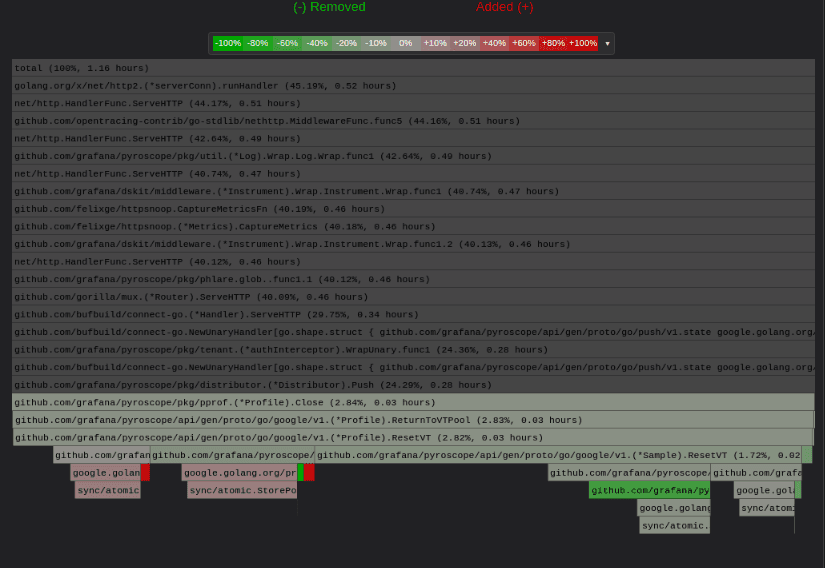
While this percentage may seem small, using PGO in your Go workflows provides a lot of value with minimal downside, so we recommend trying it out!
All the practices mentioned in this post can be used with either open source Grafana Pyroscope or Grafana Cloud Profiles. If you have any questions, feel free to reach out in our Slack channel or on GitHub!
Grafana Cloud is the easiest way to get started with continuous profiling, metrics, logs, traces, and dashboards. We have a generous forever-free tier and plans for every use case. Sign up for free now!

