Grafana Tempo 2.4 release: TraceQL metrics, tiered caching, and TCO improvements
Grafana Tempo 2.4 is here and comes with a stack of new features and enhancements to help improve performance and operational capabilities.
Check out the video above, which highlights the new experimental TraceQL metrics feature that creates metrics from traces, and continue reading to get a quick overview of all the latest updates in Tempo. If you’re looking for something more in-depth, don’t hesitate to jump into the Grafana Tempo 2.4 release notes or the changelog.
TraceQL metrics
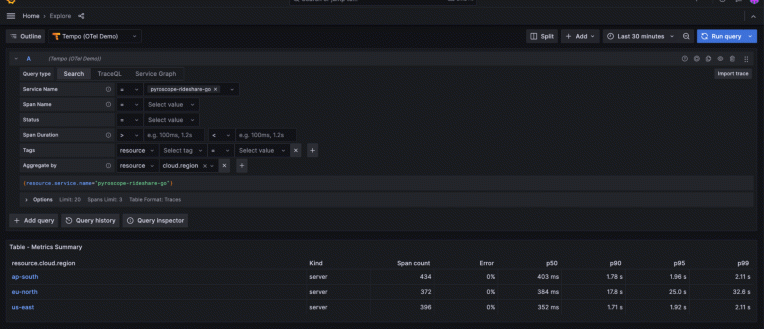
We’re excited to announce the addition of metrics queries to the TraceQL language. TraceQL metrics is an experimental feature in Grafana Tempo that creates metrics from traces.
Metric queries extend trace queries by applying a function to trace query results. This powerful feature allows for adhoc aggregation of any existing TraceQL query by any dimension available in your traces, much in the same way that LogQL metric queries create metrics from logs.
Traces are a unique observability signal that contain causal relationships between the components in your system. Do you want to know how many database calls across all systems are downstream of your application? What services beneath a given endpoint are currently failing? What services beneath an endpoint are currently slow? TraceQL metrics can answer all these questions by parsing your traces in aggregate. Check out the following examples!
Currently, we support only the rate() function, which can be added as an operator at the end of any TraceQL query. The following query will show the rate of errors by service and span name.
{ status = error } | rate() by (resource.service.name, name)

Or, consider this clever query that will show the rate of descendant errors beneath a service grouped by failing databases. In this case, an engineer wants to quickly identify any database issues downstream of an application they maintain.
{ resource.service.name = "mythical-requester" } >> { status = error } | rate() by (span.db.name)

The first pass at TraceQL metrics is most easily accessed using Grafana 10.4 (coming on March 5!) or greater. Using any Tempo data source, you can write a metrics query like the ones above with a few Tempo configuration changes. In the future, this will work out of the box, but currently it requires a few tweaks. The endpoints and Explore experience are all considered experimental for now, but we are hustling to make these GA.
TraceQL metrics are just getting started. In future releases, we will add support for additional functions, create a streaming gRPC endpoint for Grafana to consume, and continue to heavily invest in performance.
Tiered caching
Tempo now offers a more advanced and easier-to-use caching configuration. Cache is now configurable as a single block in your config file with roles attached for each cache. Tempo supports frontend search, bloom, parquet footer, and parquet page caches as of Tempo 2.4, but expect more options in the future.
Something like:
cache:
  caches:
  - memcached:
      host: <some memcached cluster>
    roles:
    - bloom
    - parquet-footer
  - memcached:
      host: <some memcached cluster>
    roles:
    - frontend-search
   …
Additionally, Tempo will now give per role cache metrics, so you can have better vision on how each cache is performing.
sum(rate(tempo_memcache_request_duration_seconds_count{status_code="500"}[1m])) by (name)

Polling and TCO Improvements
Previously, Tempo would poll the backend every configurable number of minutes. This involved listing all blocks beneath all tenants and then requesting their meta.json files one at a time. Tempo 2.4 will now nicely only request the meta.json for blocks it does not currently have information about. This creates a large reduction in the number of calls to object storage and is a nice TCO (total cost of ownership) improvement.

Cross-tenant queries
Tempo now supports cross-tenant queries across all major endpoints. For those of us running Tempo in a multi-tenant mode, it can be nice to run some queries across more than one tenant. This can be accomplished by setting a simple feature flag and passing the right header.
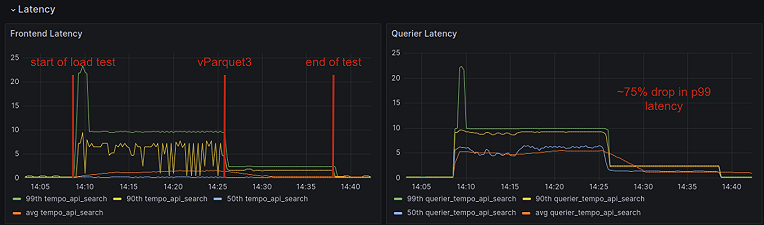
vParquet3 default
vParquet3 was introduced in Tempo 2.3 and now has been elevated to the default Tempo storage backend. If you have manually configured vParquet3, we recommend dropping it so Tempo will automatically upgrade in the future. Please check out these great details on how to use vParquet3 for optimal performance.
What’s next in Grafana Tempo?
The answer: TraceQL metrics, streaming everything, and continuing to extend the TraceQL language.
TraceQL metrics is our No. 1 focus, and we are pushing hard to make sure we continue to deliver on this feature set. Expect quantiles and all the other goodies you would love out of a metrics from traces language.
Also, we previously added gRPC streaming support in Tempo for search and have been loving the results over large queries. We intend to extend this gRPC streaming API surface to encompass all major endpoints. The work begins with a large-ish refactor. Any takers to review?
Finally, we are still working on support for lists and other complex types in TraceQL. We recently merged our TraceQL language extensions to detail how these would appear. However, the new Parquet version to support these extensions (vParquet4) just missed the cut for 2.4. To be fully transparent, these features have taken a backseat to delivering on TraceQL metrics, but they are still on the roadmap!
See you for Tempo 2.5! 😃
If you are interested in hearing more about Grafana Tempo news or search progress, please join us on the Grafana Labs Community Slack channel #tempo, post a question in our community forums, reach out on X (formerly Twitter), or join our monthly Tempo community call. See you there!
And if you want to get even closer to where the magic happens, why not have a look at our open positions at Grafana Labs?
The easiest way to get started with Grafana Tempo is with Grafana Cloud, and our free forever tier now includes 50GB of traces along with 50GB of logs and 10K series of metrics. You can sign up for free!