Grafana Cloud updates: AI for incident response, Enterprise plugins, Kubernetes alerting, and more
At Grafana Labs, we’re constantly shipping new features to help our users get the most out of Grafana Cloud. In case you missed it, here’s a roundup of all the Grafana Cloud news, updates, and improvements you should know about.
Tracing + profiling: Span Profiles in Grafana Cloud
The Span Profiles feature enables a deeper analysis of both tracing and profiling data. Traditional continuous profiling provides a system-wide view over fixed intervals. In contrast, Span Profiles delivers focused, dynamic analysis on specific execution scopes within applications, such as individual requests or specific trace spans.
Users ultimately get a more granular view of performance, enhancing the utility of profiles by linking them directly with traces for a comprehensive understanding of application behavior.
In our first month using this integrated, traces-to-profiles approach here at Grafana Labs, we improved CPU utilization by 4x, reduced our API calls to object storage by 3x, and cut costs — so, we are extremely excited to introduce this feature to the community!
To learn more about Span Profiles, check out our recent blog post.
Structured metadata in Grafana Cloud Logs
Some metadata, especially infrastructure-related metadata, can be difficult to embed in log lines, and their high cardinality means they cannot effectively be stored as indexed labels. (Read: You’ll end up reducing the performance of the index.)
Structured metadata is a way to attach metadata to logs without indexing them or including them in the log line content itself. Examples of useful metadata are Kubernetes pod names or any other label that is often used in queries but has high cardinality and is expensive to extract at query time. Structured metadata can also be used to query commonly sought after metadata from log lines without needing to apply a parser at query time.
For more information on how to configure and query structured metadata, check out our documentation.
By leveraging structured metadata under the hood, Cloud Logs can now also provide a simplified syntax and better query performance for logs sent through our Cloud OTLP endpoint. To learn more, read our documentation.
Alerting in Kubernetes Monitoring
We’re excited to introduce a simplified alerting experience in Kubernetes Monitoring to help you respond to incidents and anomalies in your Kubernetes clusters.
The new alerting experience gives you a comprehensive, bird’s-eye view, effectively eliminating the complexity associated with Kubernetes’ autoscaling and in-depth alerting infrastructure. From the Alerts page in Grafana Cloud, you can filter by cluster, namespace, and severity, and all alerts are linked directly to their respective cluster-to-container relationship. In other words, you can navigate to an issue and resolve it with one click.
To learn more about how alerting in Kubernetes Monitoring works, check out our recent blog post.
AI for incident response: New Sift features
Sift is a diagnostic feature in Grafana Cloud that’s powered by machine learning. SREs and DevOps teams can use Sift to automate routine parts of incident investigation, such as searching for new errors in logs, surfacing recent deployments, or identifying overloaded Kubernetes nodes. And with every Sift investigation, there is useful context already available by the time you see an alert or declare an incident.
We’ve recently added features to Sift, including:
- a homepage to create new investigations or to revisit existing or auto-generated incidents
- more ways to start a Sift investigation across Grafana
- an outgoing webhook available in Grafana OnCall that allows you to trigger a new Sift investigation as part of an OnCall escalation chain
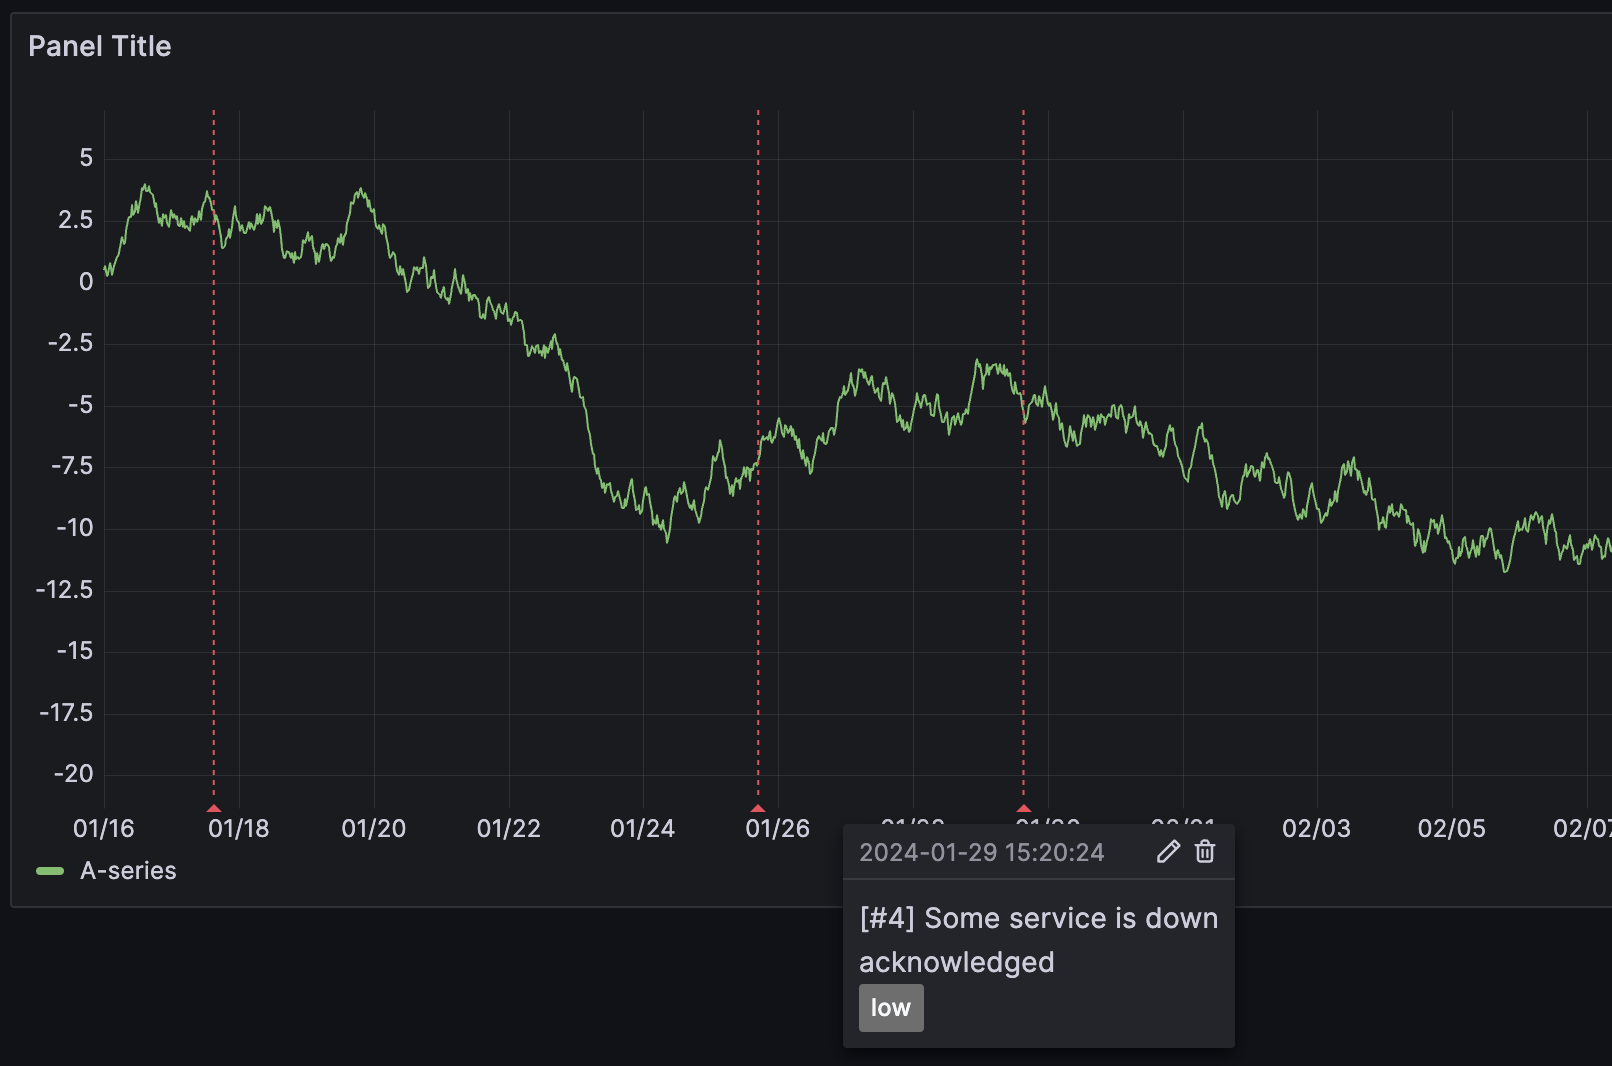
- an investigation timeline (pictured below) to correlate events
And so much more. Read our blog post to learn about all the latest capabilities in Sift.

OpenTelemetry and Grafana Cloud
We recently posted a comprehensive guide to instrumenting your Python application using OpenTelemetry. Within that blog post, we also walk through how to easily visualize and monitor your data using the Application Observability app in Grafana Cloud.
Also if you’re interested in learning about what’s new and what’s next in the world of OpenTelemetry, Grafana Labs principal engineer and OpenTelemetry maintainer Juraci Paixão Kröhling shared his thoughts in a recent blog on the future of OpenTelemetry.
New Enterprise plugins
We’ve recently expanded our catalog of more than 20 Enterprise plugins, which includes ServiceNow, Splunk, Snowflake, Datadog, MongoDB, Oracle, New Relic, Dynatrace, Wavefront, and AppDynamics. All Enterprise plugins are fully supported by Grafana Labs and are available across all tiers of Grafana Cloud, including our generous forever-free tier — an update we announced at GrafanaCON 2023. Here are the latest additions:
Sumo Logic
The Sumo Logic Enterprise plugin allows you to explore and visualize your Sumo Logic logs and metrics in Grafana Cloud. Grafana also provides annotations and alerting capabilities, allowing users to set up alerts based on both metrics and log data. Read more in our recent blog post.

PagerDuty
The PagerDuty Enterprise plugin (in public preview) allows you to query incident data or visualize incidents using annotations in Grafana. For more on how to configure the data source plugin, please see our documentation.
Grafana Cloud integration updates
Rocky Linux
Rocky Linux is a community-driven, open source operating system that is backed by CIQ, the primary sponsor and support provider. This OS is a powerful alternative for those seeking a downstream, binary-compatible option to Red Hat Enterprise Linux (RHEL).
You can now monitor Rocky Linux using the existing Linux integration in Grafana Cloud. Check out our recent blog post to learn how.

Multi-stack data sources in Grafana Cloud
It’s complicated to query across multiple data sources if you store your metrics or logs across separate tenants. Multi-stack data sources (in public preview) allows you to set up one data source that includes multiple tenants, so you can query data across different stacks simultaneously.
To learn more, read our multi-stack data sources documentation.
Note: If you’re using Grafana Cloud Free, this feature is available but may be less applicable due to the typical one-stack limit.
Cool use cases
Check out Grafana Cloud in action:
How to monitor a home VPN with Grafana Cloud
Grafana Labs senior solutions engineer Brian LeBlanc recently found himself trying to solve a real-world problem in his homelab: Accessing his home network when he was away while keeping it safe. Learn how he monitored his VPN from anywhere with Grafana Cloud.

How the open source Caddy server uses Grafana Cloud for full-stack observability
A look at why the team behind the open source Caddy server chose Grafana Cloud Pro as their end-to-end observability solution.

Grafana Cloud is the easiest way to get started with metrics, logs, traces, dashboards, and more. We have a generous forever-free tier and plans for every use case. Sign up for free now!