
How to monitor a home VPN from anywhere with Grafana Cloud
I’m a senior solutions engineer here at Grafana Labs, but I recently found myself trying to solve a real-world problem in my homelab.
The issue was, I have some services running there and I want to be able to access my home network when I’m away. Of course, I had to make sure my network remains safe when I do that, so I decided to deploy a simple and secure VPN.
The implementation I went with uses Grafana Agent to scrape VPN access logs and ships them to Grafana Cloud Logs. Grafana Cloud Logs is integrated with Grafana Incident Response Management to send Slack notifications any time a user logs into the VPN. It ensures that I’m aware of any unauthorized access to my network and gives me the peace of mind I was seeking with this implementation.
This was a really fun project that taught me how to integrate many different pieces of Grafana Cloud: log ingestion, querying logs, alerting, and integrating an external notification system. It also helped me learn our product suite so that I can assist customers in my role at work.
Even cooler: The VPN service I used is free, so anyone who has the required hardware can do what I did using the free tier of Grafana Cloud.
In this post, I’ll explain how I set it all up.
A bit of background
Before I began any of this, I was running one kind of VPN server and then I became aware of Wireguard. Wireguard is a very easy to deploy VPN solution that delivers fast performance and a high level of security. However, one of the big drawbacks of Wireguard is that it uses public and private key exchanges for authentication without any username and password-based authentication.
I try to keep all my important credentials secure with multifactor authentication. There is an argument to be made regarding the handling of the key pairs. You can have a very secure lock, but you are creating an insecure environment if you leave the keys in an insecure location. Conversely, if you have a reasonably secure lock and you take great care of the keys, you may feel comfortable with the level of security it delivers.
I didn’t feel comfortable deploying Wireguard if I wasn’t going to have visibility into unauthorized sessions on my VPN server, so I sought out some possible solutions.
Option 1: Use Tailscale instead of Wireguard
Tailscale is an implementation of Wireguard that adds multi factor authentication. It stores the key pairs, and VPN clients are challenged with MFA before the keys are unlocked so that the VPN connection from the client to the server can be established. This is an elegant solution with one fundamental problem: If Tailscale’s key store is compromised, every user’s keys are now available to the bad actors. (You could make the argument that this is their entire business model and they will therefore safeguard people’s information. The same argument was made about one of the largest password vaults — who I will not name — and they were compromised in the last couple of years. This exposed all their users to threats.) I didn’t want to put myself in the position of being at risk and having to migrate to a new solution due to a bad model. There are password managers such as 1Password that use zero knowledge platforms which represent a more secure solution.
Option 2: Use Headscale instead of Wireguard or Tailscale
Headscale is a self-hosted open source version of Tailscale. This eliminates the problem of trusting someone else managing the key store. The downside for me, though, is that it’s another service to have to manage, and I take a holistic approach when deciding if I want to manage something myself or use a cloud or SaaS based solution in my homelab.
Option 3 (my chosen solution): Use Wireguard on my existing hardware and monitor logins using Grafana
I’m the only user of the VPN, so I know if I receive a message from Grafana Alerts it means that there has been some unauthorized access. This is a very unlikely scenario since I manage my keypairs carefully, but it gives me the additional peace of mind I wanted from the beginning.
The setup
I have a Unifi Dream Machine SE as my home router. The UDM SE supports Wireguard natively and has the ability to forward its logs to a remote unix syslog server. I have an Intel NUC running Debian Linux and Grafana Agent that is receiving the logs. Grafana Agent sends the forwarded logs to Grafana Cloud.
I was able to configure an alert on Grafana Cloud that reads the logs and sends alerts via Grafana IRM to a personal Slack workspace. Every time a user logs into the VPN, I receive one of these notifications:

I also have this dashboard available, which shows how many sessions were created:

The free tier of Grafana Cloud is really useful for these types of simple implementations.
Inside the implementation
Follow these steps to set up your own home network VPN monitor.
Step 1: Configure the VPN
Instructions for how to do this are available on Ubiquiti’s site or on this third party site with more details. You need to configure at least one client after you configure the server. Details on how to install clients can be found on Wireguard’s site.
My VPN client on my iPhone now has this entry:

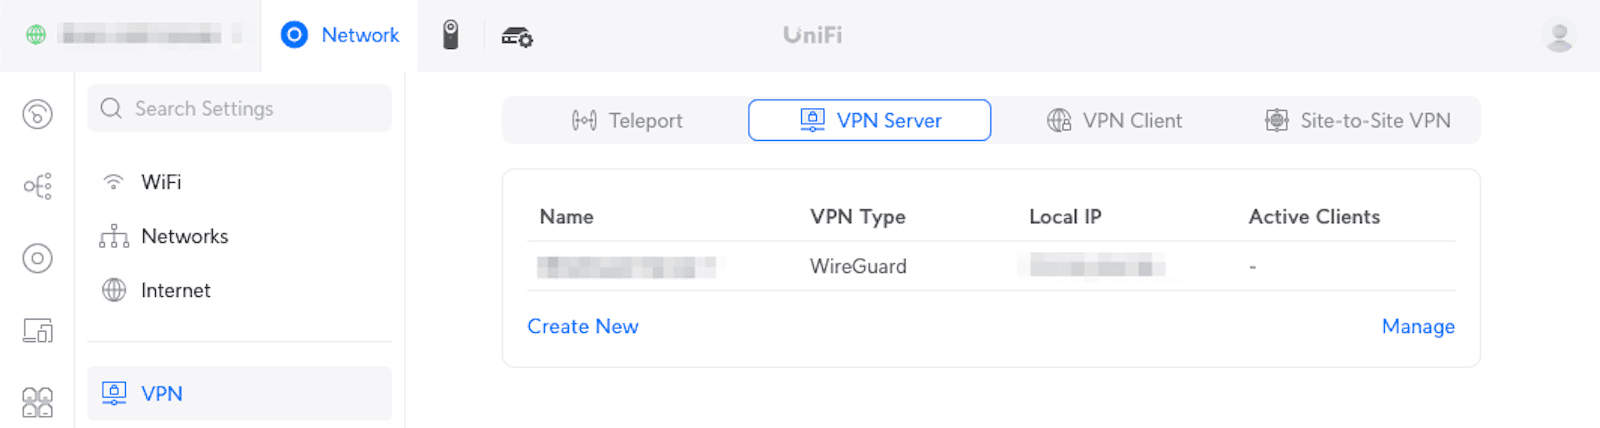
My UDM SE has the following VPN server configured:
Step 2: Deploy a remote syslog server
This implementation requires a remote syslog server. You may have one already that you can use for this implementation. If you do not, the easiest thing to do is to deploy a Linux server on a Raspberry Pi, through a container if you are running Docker on a homelab server, or with another virtualization platform. I’m going to skip this step based on the assumption you know how to deploy a Linux server or use one you already have deployed. Instructions on how to deploy a syslog server on Debian Linux once you have the server deployed are here.
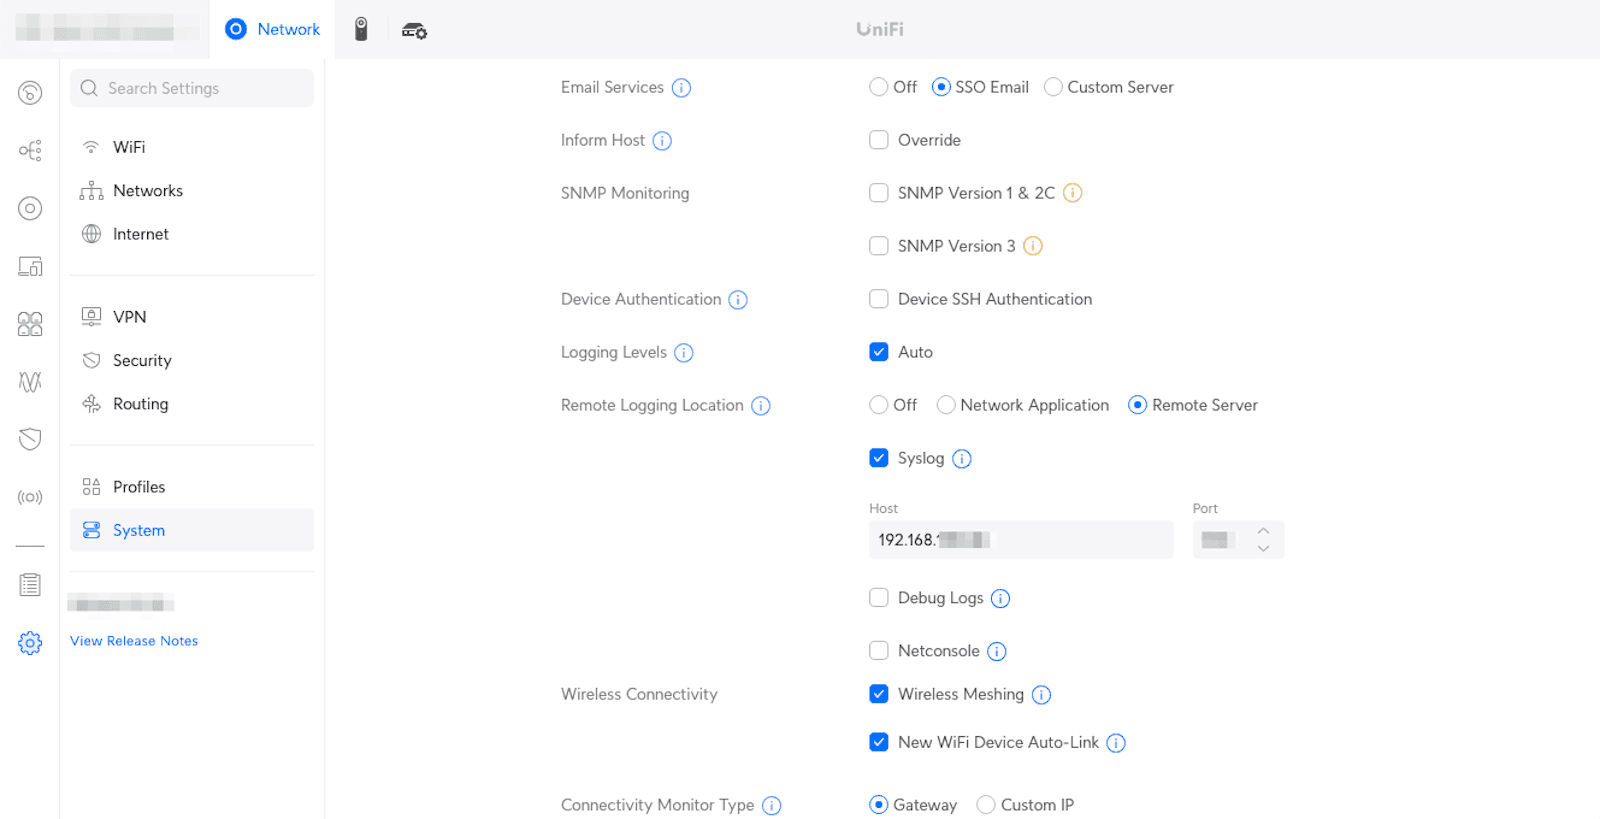
You can deploy remote logging on the Unifi router using these instructions. I configured it on my UDM, and here’s a screenshot of what that looks like:
Step 3: Install Grafana Agent
You can find the instructions on how to deploy Grafana Agent in our docs. The installation on Linux is very easy if you’re familiar with installing packages using apt-get. You can check the status of the service using systemctl. Executing the command sudo systemctl status grafana-agent displays the following:

The agent does not scrape the right logs by default, so you have to add a job to the configuration file in order to tell it to scrape them. You can see the location of the configuration file being used by the agent in the above screenshot or in your systemctl output. In my case, this file is /etc/grafana-agent.yaml. These instructions in our documentation portal explain how to send logs to Grafana Cloud Logs/Grafana Loki.
I recommend making a backup of the .yaml file before you change it. This allows you to roll back quickly if you make a mistake in the .yaml. I prefer to use vi for editing text files on linux. The following command will open the file in vi with sudo privileges (necessary for editing files in /etc/): sudo vi /etc/grafana-agent.yaml.
You probably have some existing entries in this file. The job I added to capture the necessary log files is the following (I removed my real console name):
    - job_name: unifi_log_scrape
      static_configs:
      - targets: [localhost]
        labels:
          job: unifi_log_scrape
          __path__: /var/log/[my-unifi-console-name-here]/*.log
When you update the grafana-agent.yaml file, you’re required to restart the service in order for it to take effect. The command is sudo systemctl restart grafana-agent. When you check the status, you should see it started successfully with the new configuration.
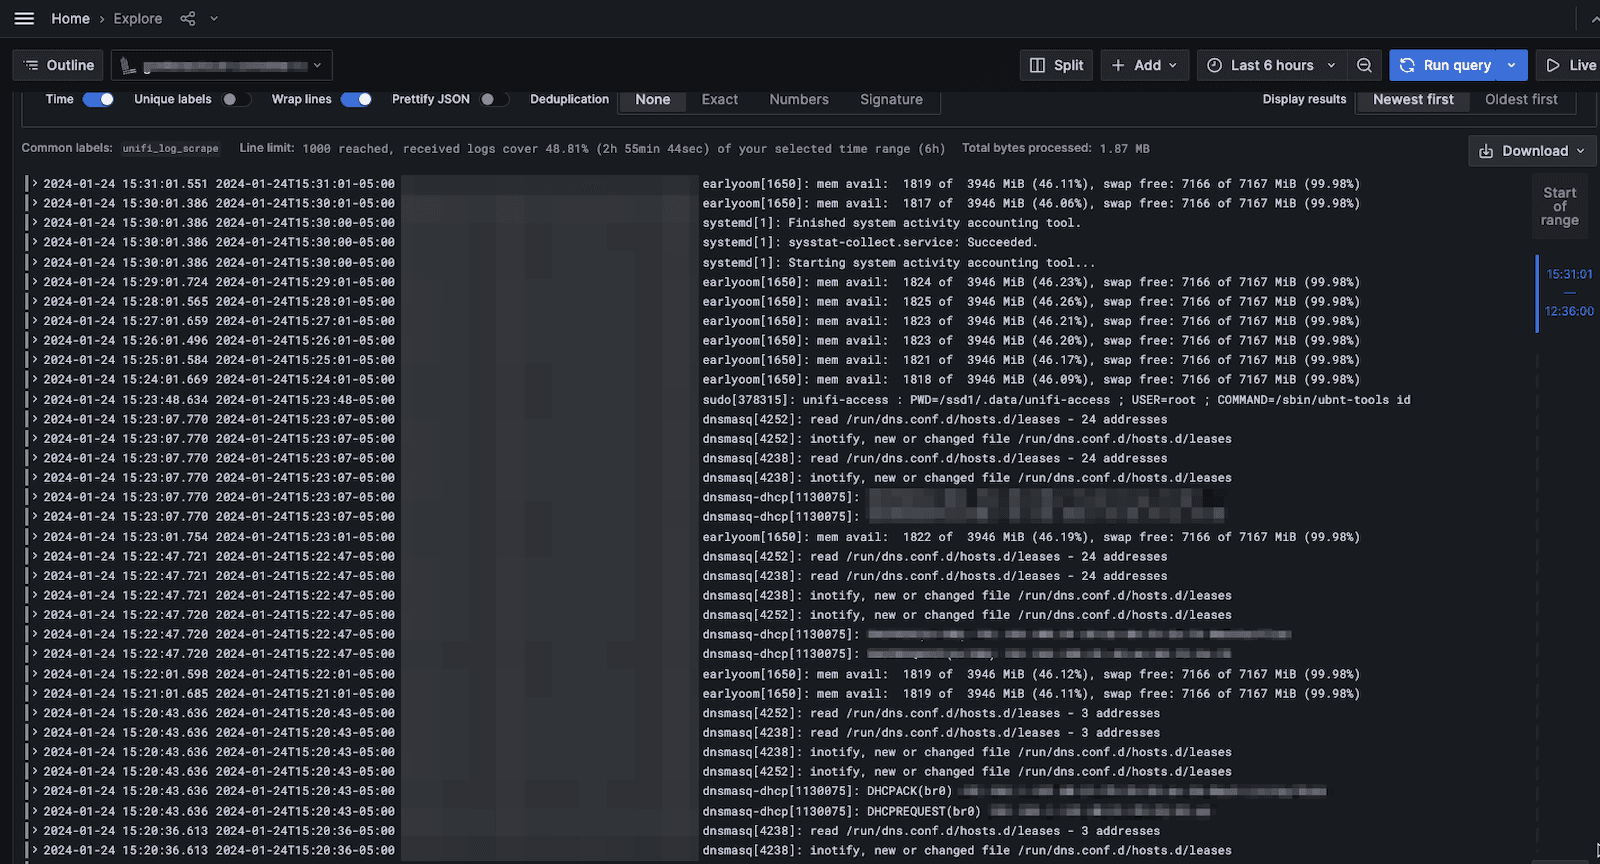
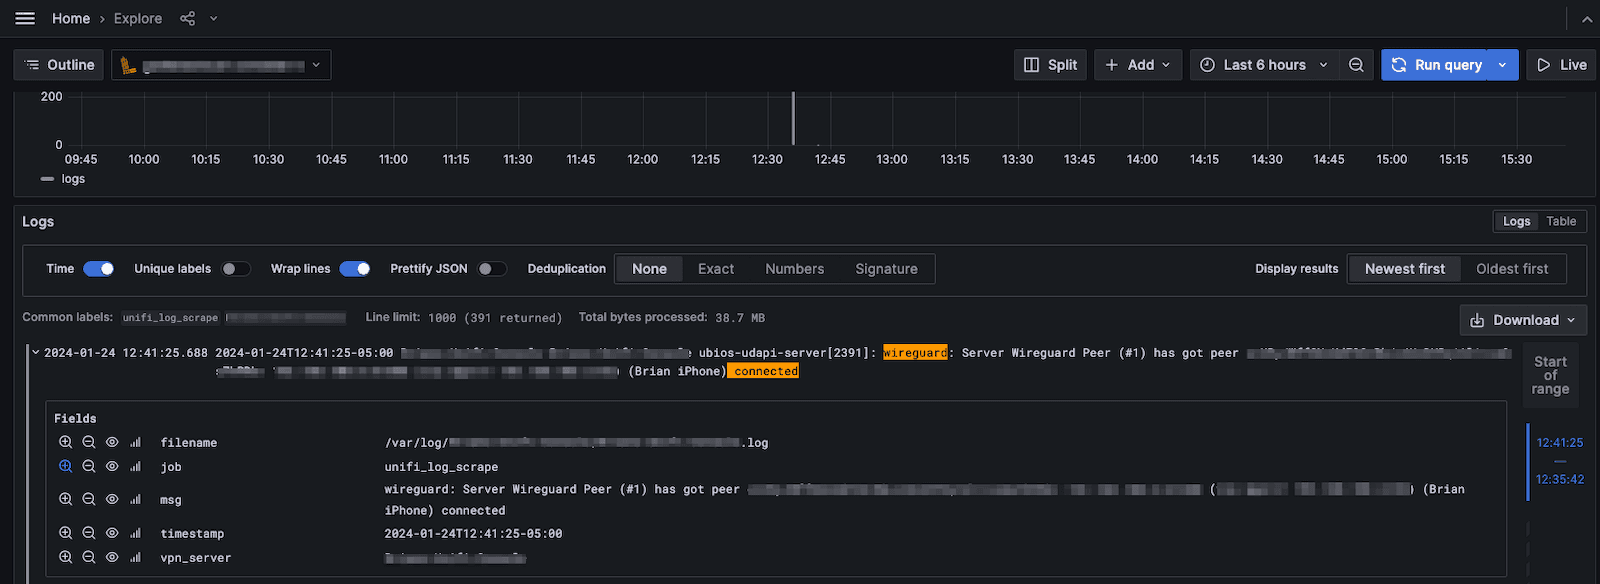
The instructions for collecting logs with Grafana Agent include instructions on how to verify that your logs are being ingested correctly. In the Explorer view below, you can see how I queried the logs by the filename to show that logs are being ingested correctly.

Step 4: LogQL to Query VPN Logs
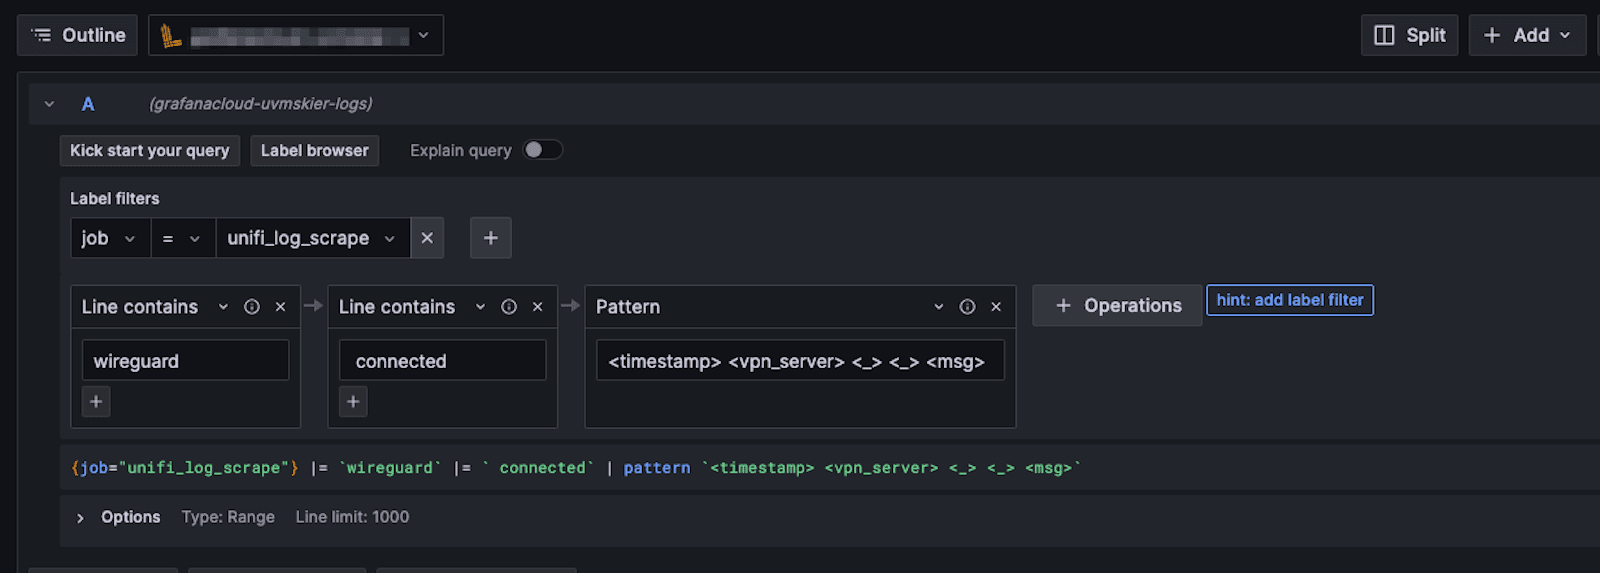
Now you need to write a LogQL query that is going to query just the log lines that represent a new VPN connection. This does the job:
{job="unifi_log_scrape"} |= `wireguard` |= ` connected` | pattern `<timestamp> <vpn_server> <_> <_> <msg>`
The first part of the query only queries the job unifi_log_scrape. The second part filters for the phrase wireguard. The third part filters for lines containing ` connected`. The last part is a command to use the pattern command to break the unstructured log line into a few useful fields. You can write the LogQL by entering the text or using our builder view:
Here is a sample log entry:
I created a dashboard with a panel that has a stat showing the total number of sessions during a given time period. The below query and panel configuration shows how to create the stat using the count_over_time function to convert the log entries to a number that can appear in a stat panel.

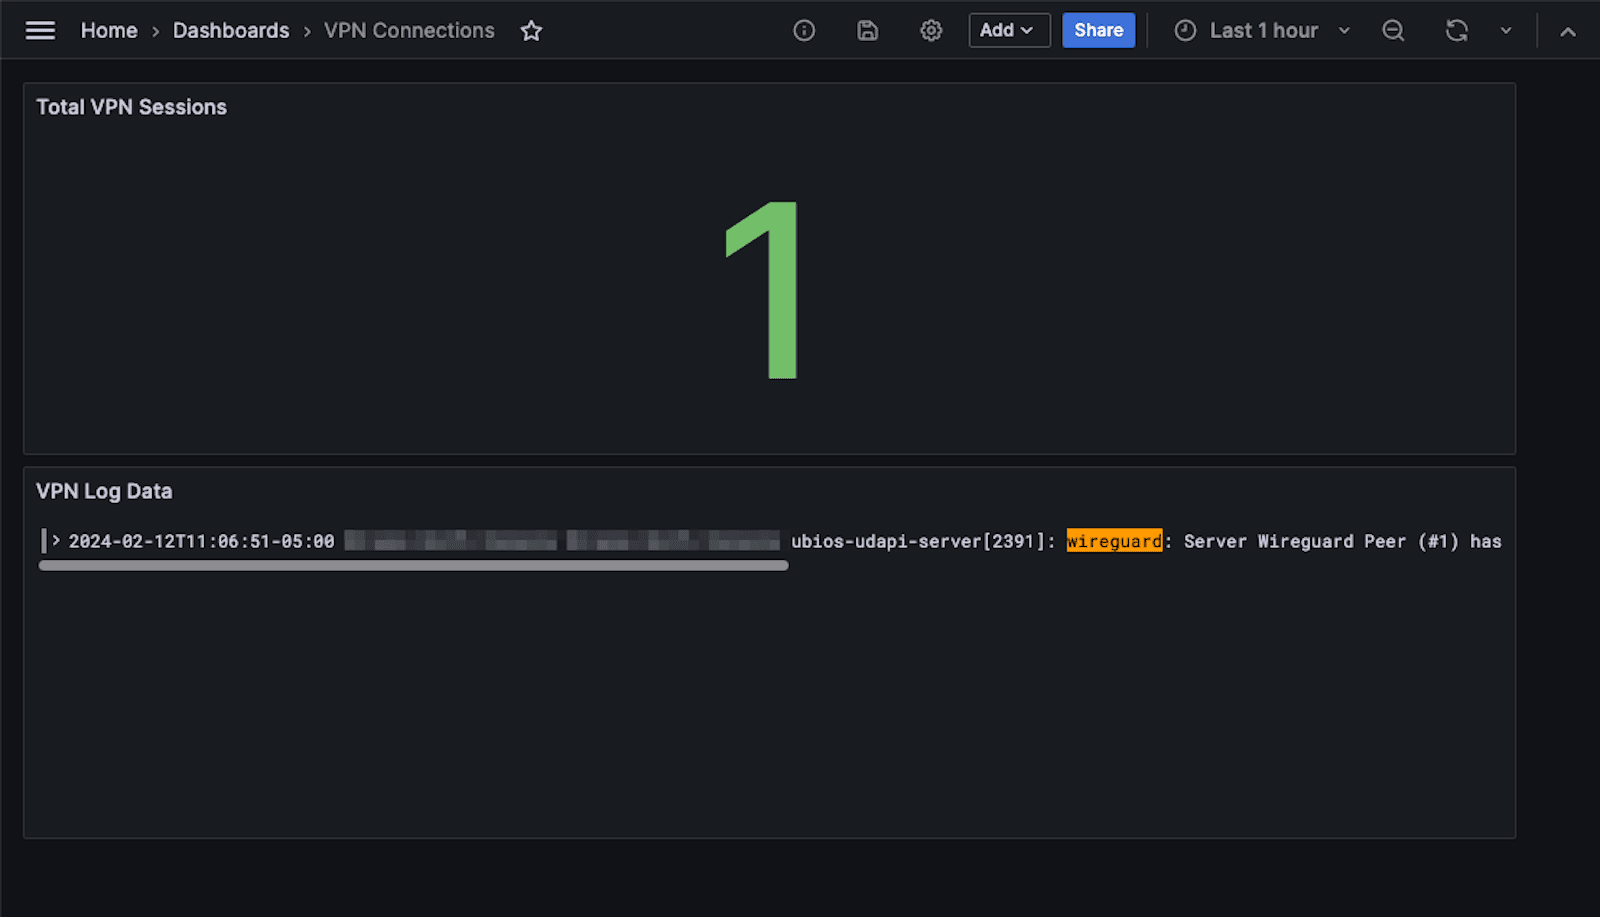
I also created a dashboard panel to show the raw log data during a given time period. The below screenshot shows the query and panel configuration:

Here is the completed dashboard:
At this point, you should have the following:
- Wireguard VPN configured on the Unifi Dream Machine SE
- A VPN client configured
- A remote syslog server deployed
- Remote logging enabled on the Unifi Dream Machine SE and it’s sending logs to the syslog server
- Grafana Agent reading the Unifi logs and sending them to Grafana Cloud
Step 5: Configure an alert and route it through Grafana IRM to Slack
Detailed instructions on how to create an alert can be found in our documentation. Below are a simple set of instructions I put together for this use case.
In Grafana Cloud, navigate to Home > Alerts & IRM > Alerting > Alert rules > new alert rule.

I named my alert New VPN Session Alert. The query is similar to the query in the dashboard except I added the count_over_time aggregate function to count the number of lines returned by the query (how many VPN logins occurred) and set the time to $__auto to respect the time range being queried by the alert (the last 1m).

The expressions take the results of query A, and query B reduces it to the last result. Query C takes query B as an input and applies the threshold IS ABOVE 0. This means that any time the query returns more than one line, the alert should fire. This is what you want since any time there is more than one line, there is a new VPN connection based on your query of the logs.

I created a folder to store this alert and an evaluation group. The pending period is 1m, meaning that the alert can be in breach for one minute until the alert fires. You are not allowed to set it to zero minutes or zero seconds. One minute made sense in my use case.
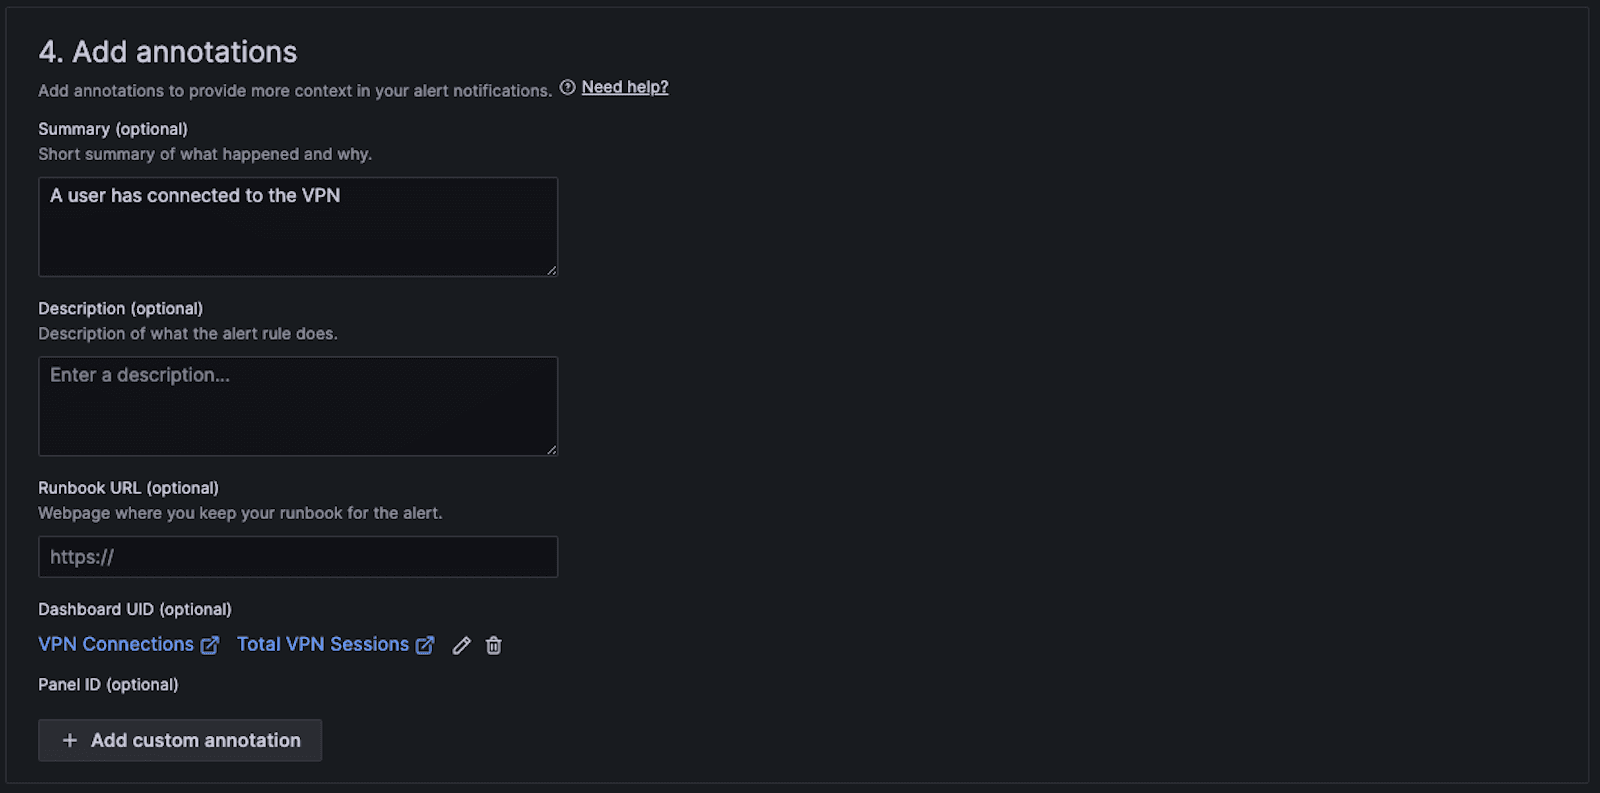
I set some basic annotations that appear in the Slack message.
Grafana alerting uses a notification policy and a contact point to determine where to route alerts. In my case, the destination for the alerts is Grafana OnCall.


You need to configure OnCallin order for it to be able to publish messages to Slack. (Our documentation has detailed instructions on how to create the connection.)

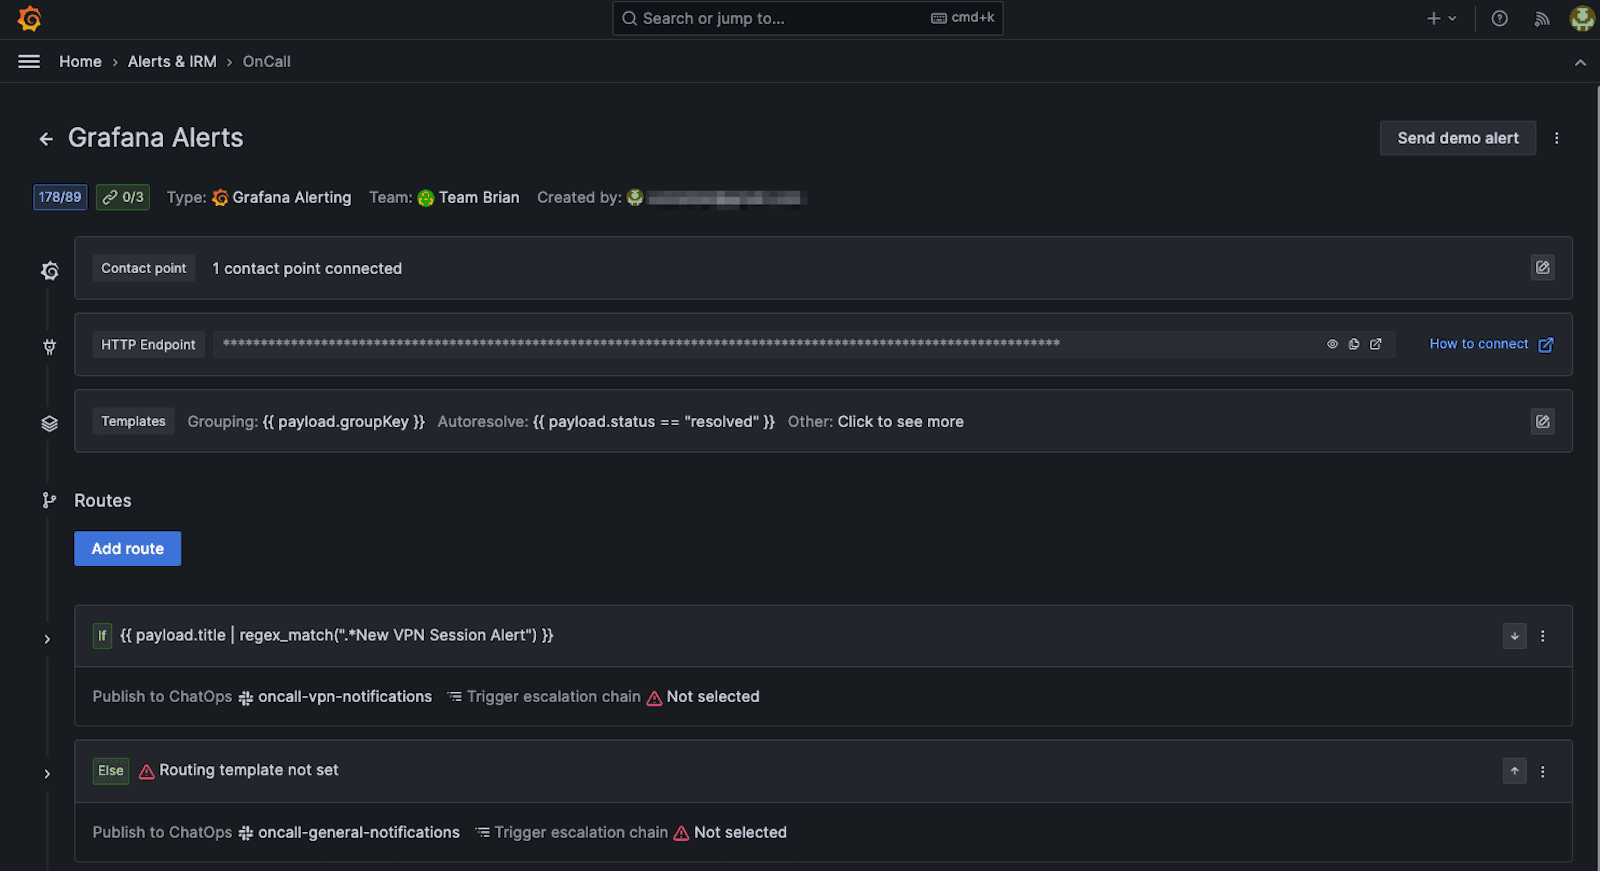
I could route alerts to specific groups of users based on a call rotation schedule and define an escalation chain if someone does not respond to the alert. However, my use case only has one user (me) so the simplest solution is to publish these alerts to a dedicated Slack channel for VPN alerts and to not create an escalation chain. To do that, I updated the pre-created integration in Grafana OnCall for Grafana Alerts to contain a route that matches a payload titled “New VPN Session Alert.” It publishes these alerts to a channel called oncall-vpn-notifications.
Below is a screenshot of my configuration once I completed the steps in the documentation.
Security success
As a result of that effort, I now receive a Slack notification any time a new VPN session is established. I’m the only user using the VPN so the alerts are easy to anticipate, but I also have peace of mind knowing I’ll find out if there is any unauthorized usage.
I hope you try it out for yourself!
Want to share your Grafana story and dashboards with the community? Drop us a note at stories@grafana.com.
Grafana Cloud is the easiest way to get started with metrics, logs, traces, dashboards, and more. We have a generous forever-free tier and plans for every use case. Sign up for free now!

