AI-powered diagnostics for incident response: New Sift features in Grafana IRM
Sift is a machine-learning-powered diagnostic feature in Grafana Cloud that SREs and DevOps teams can use to automate routine parts of incident investigation, such as searching for new errors in logs, surfacing recent deployments, or identifying overloaded Kubernetes nodes. We want Sift to springboard you into an investigation, so useful context is already there by the time you see an alert or declare an incident.
Since we launched Sift into public preview last year, we’ve worked hard to improve it. We’ve added a lot of great new features, including a new homepage, more ways to start a Sift investigation across Grafana, and some relaxed constraints that allow you to investigate services that aren’t run in Kubernetes. We’re excited to see users put these new capabilities into action, so let’s take a look at some of the biggest improvements we’ve made in recent months.
Making it easier to run investigations
Until recently, Sift investigations were only ever triggered by Grafana Incident, which limited Sift’s functionality. In the last couple of months we’ve added a whole host of additional ways to run Sift investigations, spanning across Grafana and beyond.
The most exciting of these is the new Sift outgoing webhook available in Grafana OnCall. This webhook allows you to trigger a new Sift investigation as part of an OnCall escalation chain, so you can have an automatic investigation of every single alert group. Sift will even post the results back to the resolution notes of the alert group so you can see them from Slack or OnCall before you’ve even acknowledged the alert!


We’ve also made it possible to run Sift investigations from various pages inside Grafana: you’ll find buttons in Explore, the dashboard panel menu, the alert instance table, Grafana OnCall alert groups, and the command palette. These entry points allow you to trigger a Sift investigation based on the current page, and they will attempt to populate the form using any queries or alerts on the source.
It’s always worth double-checking the labels on the form — Sift will still work best with cluster and namespace labels, so be sure to add those if it makes sense. As you can see from the brief video below, you can trigger a new Sift investigation from a Grafana panel. Labels used in the query are added directly to the form.
There’s supposed to be a video here, but for some reason there isn’t. Either we entered the id wrong (oops!), or Vimeo is down. If it’s the latter, we’d expect they’ll be back up and running soon. In the meantime, check out our blog!
A new home for Sift
Sift has a new homepage! Previously, Sift was only accessible during an incident, but now Sift results can now be found in the sidebar, under Alerts & IRM > Machine learning > Sift investigations. (You can also use the search functionality on the top of Grafana to reach Sift.) In addition, you can use the updated Sift homepage to create new investigations or to view any existing or automatically generated investigations.


Sift: It’s not just for Kubernetes
The first iteration of Sift required Kubernetes-based labels to function properly. More specifically, you had to add cluster and namespace labels to trigger an investigation. This is no longer the case, and Sift will run an investigation for any set of labels. However, if you are running in Kubernetes there are some analyses that are only run if cluster and/or namespace is provided, so keep specifying those if you can!
Choose your labels with care: they control the scope, which reduces noise and speeds up the investigation. When creating an investigation, provide a set of labels that identify the services you are interested in investigating. See the Label Management section of the Sift docs for more information.
Configurable checks
Sift does its best to investigate issues without generating too much noise, but sometimes it needs more guidance. The new “Configuration” tab of the Sift homepage allows you to customize the way Sift runs, whether that’s adjusting thresholds for when a result is considered “interesting,” running checks multiple times with different config, or disabling checks altogether.

A new check for HTTP services
We’re also adding a new check: HTTP Error Series. This check is designed to detect an increase in HTTP errors within the investigation’s cluster and namespace. It highlights metrics with elevated 4xx and 5xx error codes, providing a graphical representation of the overall metric and a by-label view for quick issue identification.
As you can see in the short video below, you can drill down to immediately identify the source of a problem using the new HTTP error series check.
There’s supposed to be a video here, but for some reason there isn’t. Either we entered the id wrong (oops!), or Vimeo is down. If it’s the latter, we’d expect they’ll be back up and running soon. In the meantime, check out our blog!
An investigation timeline to help correlate events
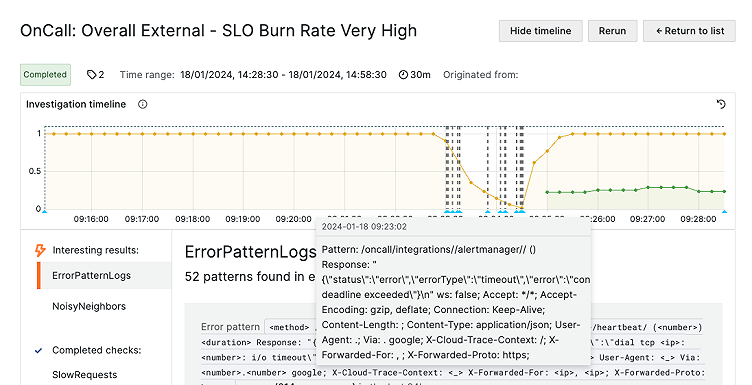
Sift now tracks the metric associated with the alert or SLO that triggered the investigation, and it charts that metric on a timeline panel for quick reference. Events found by Sift’s checks are then overlaid on the metric as annotations to allow easy correlation between different events. For instance, in the screenshot below, an easy observation is that error patterns of a specific type started exactly as the SLO budget burn alerts started firing for one of our services!

Get started with Sift today
Even with all these new features we still have endless ideas for how to improve Sift, including more intelligent label selection, revamped UIs for our existing checks, and brand new checks to help you resolve incidents faster and reduce MTTR.
Try Sift in Grafana Cloud today and see how it can help you automate investigations. Sift is available in all Grafana Cloud tiers at no extra cost. If you want to provide any feedback, please reach out in the #machine-learning channel in the Grafana Labs Community Slack.
Grafana Cloud is the easiest way to get started with metrics, logs, traces, dashboards, and more. We have a generous forever-free tier and plans for every use case. Sign up for free now!


