
Kubernetes alerting: Simplify anomaly detection in Kubernetes clusters with Grafana Cloud
Despite the widespread adoption of Kubernetes, many DevOps teams and SREs still struggle to troubleshoot issues because of all the complexity that comes with the open source container orchestration platform.
That’s why we developed Kubernetes Monitoring, an application in Grafana Cloud you can use to visualize and alert on your Kubernetes clusters. We continue to invest in providing a more opinionated experience so you can troubleshoot issues faster and easier, and we’re excited to tell you about a new, simplified alerting experience to help you respond to incidents and anomalies in your clusters.
In this blog, we’ll show you how to leverage the new functionality, which is particularly helpful for less experienced users and teams managing large fleets of containers.
The benefits of the updated Kubernetes alerting
The new alerting experience gives you a comprehensive, bird’s-eye view, effectively eliminating the overwhelming complexity associated with Kubernetes’ autoscaling and in-depth alerting infrastructure. From the Alerts page, you can filter by cluster, namespace, and severity, and all alerts are linked directly to their respective cluster-to-container relationship, meaning you can navigate to an issue and resolve it with one click.
Ultimately, the goal is to surface these alerts, which are tied directly to metrics and log data, more easily and provide guidance so you can make informed decisions about what actions you should take. In short, this update enables users to:
- Visualize potential issues such as CPU throttling directly in the app — no context switching needed
- Use the new container details page for an even more granular view of your infrastructure
- Go directly from an alert on the homepage to specific configuration values you need to change
- Take corrective actions based on our recommendations
Previously, you had to jump to Grafana Alerting to assess why the alert was triggered and navigate through all your alerts, including those unrelated to your Kubernetes environment. Then, you had to jump back to Kubernetes Monitoring to resolve the issue. Now, you can do it all directly in the Kubernetes Monitoring app, making it much easier to resolve incidents in a timely manner.
We’ve also added recommended actions based on your specific workload configuration. For example, a non-expert user might see panels like the ones below that display the CPU limits and requests sizing. They might not know the proper settings before going into the dashboard, but a quick glance at the current and recommended states will help them adjust accordingly and keep resource consumption on track.
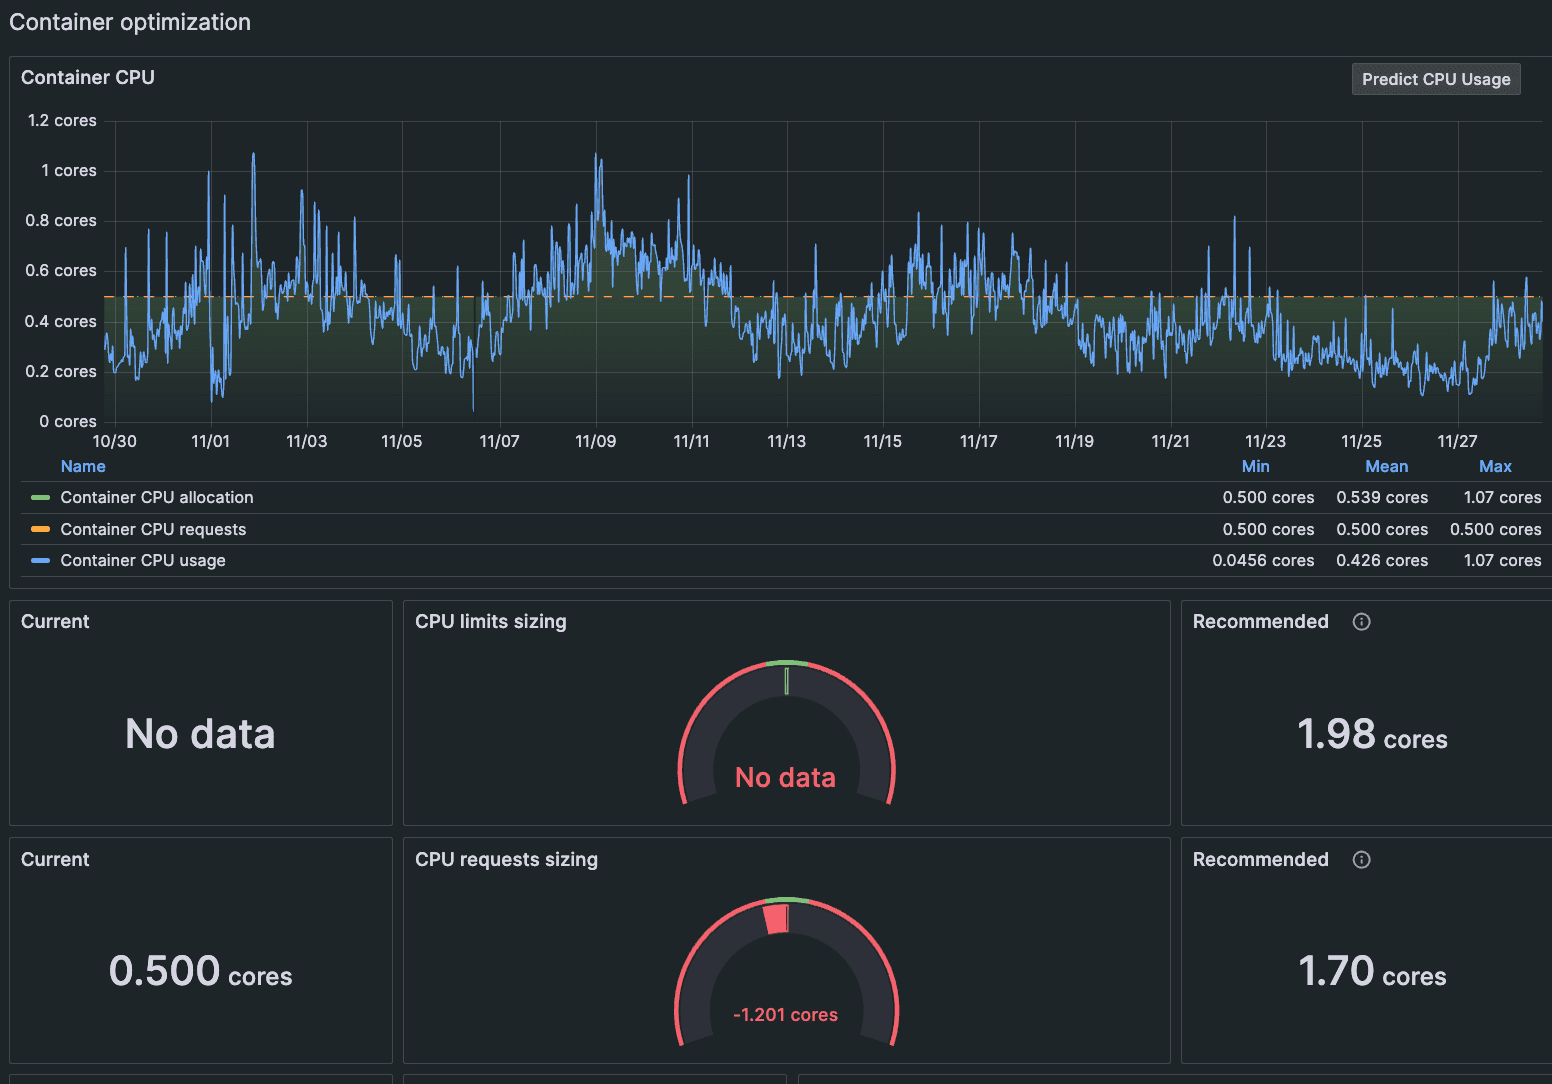
Not everyone will know the exact meaning of all the values that have been set, but now they’ll be able to make the appropriate change, even if they don’t know exactly what that change means. This is particularly helpful for on-call staff, who have to jump into incident response for a workload they wouldn’t otherwise work on.
Even experienced users can benefit from this new functionality, as their area of experience might not overlap with one of the dozens of alerts that could potentially fire at a given moment.
Managing fleets of containers
There’s also a new Alerts page, which will be especially useful for teams managing large fleets. That page shows you any alert that affects any object in Kubernetes, across all your Kubernetes clusters.
Some of our larger customers have run into challenges specific to massive deployments, such as issues with horizontal pod auto scalers. With this top-level perspective, they can see which specific nodes are having problems and dig into the issue. This should help teams dealing with alert fatigue as they’re able to narrow their view from hundreds of alerts to just a handful.
Predict future usage
We’re also doing more to help you get ahead of future issues related to resource consumption. If you have Grafana Machine Learning enabled, you can click a button to show predictive graphs for memory or CPU usage up to one week into the future. These predictions are based on metrics from the previous week, and they can be displayed on dashboards for clusters, namespaces, workloads, nodes, pods, and containers.

How to quickly respond to alerts in the new UI
Existing users don’t need to make any changes to use the new functionality, which we rolled out to Kubernetes Monitoring users this month. (If you’re new to Grafana Cloud, check out our documentation on how to create alerts.) You can filter by cluster, severity, namespace, and more, and you can expand the lookback window as needed.

To respond to an incident, you can start from the snapshot on the app homepage, where you can click directly into the pod, namespace, or cluster.

Alternatively, you can start from the Alerts page. Simply navigate to the left-side menu and go to Infrastructure → Kubernetes → Alerts. You can use the same filtering at the top of the page to narrow your troubleshooting to just the related firing alerts. You can also filter that list to isolate a specific cluster, namespace, workload, pod, or container.

To learn more about how to get the most out of this functionality, check out our documentation on strategies for assigning CPU limits and requests per container. And watch the video below to get a quick look at how to use the Alerts page to detect anomalies and take corrective action.

All your existing alerting rules will carry over to the new experience. If you haven’t used Kubernetes Monitoring before and want to learn more about getting started, check out our documentation on how to configure the app.
Start using the new Kubernetes Alerts page today
We’re excited to see how teams use this new functionality as part of their observability strategy and how it saves them time and effort as a result. It’s part of our continued effort to make it easier to monitor your Kubernetes environment, and follows a series of other updates we’ve made in recent months.
To find out for yourself, read about how Kubernetes Monitoring in Grafana Cloud can help you accelerate time to value and identify root causes faster. Or check out Grafana Play, where you can test it out yourself.
Grafana Cloud is the easiest way to get started with metrics, logs, traces, dashboards, and more. We have a generous forever-free tier and plans for every use case. Sign up for free now!

