New in Grafana k6: The latest OSS features in v0.49.0 and static IPs in Grafana Cloud k6
Grafana k6 v0.49.0 has been released, featuring a built-in web dashboard for real-time result visualization and tons of other improvements for Grafana k6 OSS.
Here’s a quick overview of the latest features in Grafana k6 v0.49.0, as well as some other exciting updates related to Grafana Cloud k6 and the k6 ecosystem. To learn more about k6 and performance testing, check out the Grafana Labs blog.
🙌 Grafana k6 v0.49.0 release
The latest k6 release features:
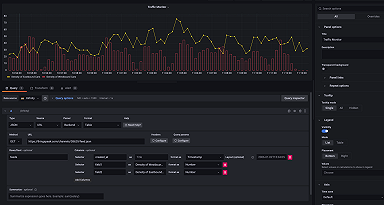
A built-in web dashboard that displays test results in real time: To activate this feature, use the environment variable K6_WEB_DASHBOARD=true.
K6_WEB_DASHBOARD=true k6 run script.jsOnce enabled, and the test script is running, navigate to http://localhost:5665/ in your web browser to access the dashboard. Learn more about how to use the web dashboard in our documentation.

Core gRPC streaming (promoted to core from experimental): With this release, gRPC’s streaming API becomes part of the core k6/net/grpc module. The experimental k6/experimental/grpc has been back-merged into the core.
The v0.49.0 release includes more improvements, minor changes, and fixes from the k6 team and the community. Check out the full list in the k6 release notes.
🌐 k6 browser updates
k6 browser lets you automate browser actions and collect web performance metrics for your k6 tests. With the k6 v0.49.0 release, the browser module now generates traces that represent its inner workings, such as API methods executed, page navigations, and Web Vitals measurements. To enable traces, set the --traces-output argument in the k6 run command or the K6_TRACES_OUTPUT environment variable. To learn more about traces, check our documentation.
We have also added a clear method to the locator class to clear values on textboxes and input fields. For example, you can use the following code snippet to clear existing values on textboxes or input fields before filling in the new value.
import { browser } from 'k6/experimental/browser';
import { check } from 'k6';

...

const page = browser.newPage();

await page.goto('https://test.k6.io/my_messages.php');

// To mimic an input field with existing text.
page.locator('input[name="login"]').type('admin');

check(page, {
   'not_empty': p => p.locator('input[name="login"]').inputValue() != '',
});

// Clear the text.
page.locator('input[name="login"]').clear();

check(page, {
   'empty': p => p.locator('input[name="login"]').inputValue() == '',
});

page.close();
☁️ New in Grafana Cloud k6
Last year, we announced the general availability of Grafana Cloud k6, our fully managed performance testing solution in Grafana Cloud. As of January 30, most current app.k6.io users can seamlessly migrate to Grafana Cloud k6. Please keep an eye out for communications from us. We are excited about this, as it will unlock a lot of features for these existing customers.
In the meantime, we continue to add more features to Grafana Cloud k6. Some of the latest additions include:
Self-serve static IPs: Static IPs are IP addresses that provide additional security and convenience when running your performance tests. With static IPs, you can allowlist traffic from Grafana Cloud public load generators, and identify logs and traffic created by your tests. Learn more about how to enable and manage static IPs in our documentation.

Improvements to user-defined project limits and quotas, including:
- The ability to quickly reset limits to the project settings
- Displaying VUh usage and quotas on the project page
Enhancements to the k6 datasource, including:
- The new Group By functionality when querying test result metrics, which allows multiple time series to be plotted as the result of one query. The query experience is now more similar to the Prometheus datasource.
- Support for exemplars when querying trace metrics.
🔧 k6-operator
k6-operator v0.0.13 was released, with new features, including:
- Support for
containerSecurityContext, which is a must-have in Kubernetes setups with security policies in place. - PrivateLoadZone test runs now
setupandteardownonly once, similar to how this process happens in Grafana k6 Cloud. - The ability to configure
envFromfor the initializer pod.
With the help of our contributors, Helm has been polished a bit more as well. Some bug hunting has also happened, and more stabilization efforts are expected in the future.
Finally, we published a Troubleshooting guide for k6-operator. Its contents are based not only on the k6-operator developer experience, but on observations and troubleshooting best practices from the community.
⚙️ The latest on k6 extensions
It seems a lot of folks working in the extensions ecosystem have been getting some well-deserved rest this cycle! 🫶
As for official extensions, xk6-kubernetes v0.9.0 was released. This release updated to the latest client for Kubernetes v1.27 clusters. Thanks to @davidpst, we now have token authentication support.
We’ve also archived the xk6-distributed-tracing extension. This functionality is now provided in the k6 binary as an experimental extension, and no longer requires a custom build using xk6. You can find more details in the documentation.
From the community, we’ve seen updates for the following:
We’ve also welcomed the following additions to the extensions registry:
- domsolutions/xk6-fasthttp: Enables use of the fasthttp client library for increased request rates using HTTP/1.1.
- kelseyaubrecht/xk6-webtransport: Supports bidirectional streams using the WebTransport protocol.
As always, a huge thank you to our community! We look forward to celebrating more contributor successes!
If you are interested in upcoming k6 news or want to connect with the k6 community, please join us on Slack, Twitter, LinkedIn, or YouTube. Happy testing!
Download the latest version of k6 OSS today, or get started with performance testing on Grafana Cloud, which has a generous forever-free tier that includes 500 Virtual User Hours (VUh) and plans for every use case. Sign up for free now!


