
Combining tracing and profiling for enhanced observability: Introducing Span Profiles
In today’s complex data landscape, continuous profiling has become essential for detailed insights into application resource usage. Grafana Labs is now advancing this field with the introduction of Span Profiles in Grafana 10.3.
The Span Profiles feature represents a major shift in profiling methodology, enabling deeper analysis of both tracing and profiling data. Traditional continuous profiling provides a system-wide view over fixed intervals. In contrast, Span Profiles delivers focused, dynamic analysis on specific execution scopes within applications, such as individual requests or specific trace spans.
This shift enables a more granular view of performance, enhancing the utility of profiles by linking them directly with traces for a comprehensive understanding of application behavior. As a result, engineering teams can more efficiently identify and address performance bottlenecks.

In our first month using this integrated, traces-to-profiles approach here at Grafana Labs, we improved CPU utilization by 4x, reduced our API calls to object storage by 3x, and cut costs (more on this below) — so, we are extremely excited to introduce this feature to the community!
Integrating with Grafana’s trace view: a seamless experience
With Span Profiles, you can uncover specific performance details within execution scopes. For example, instead of just knowing that a particular span took 400ms, you can understand what specific code was running for that 400ms time period.
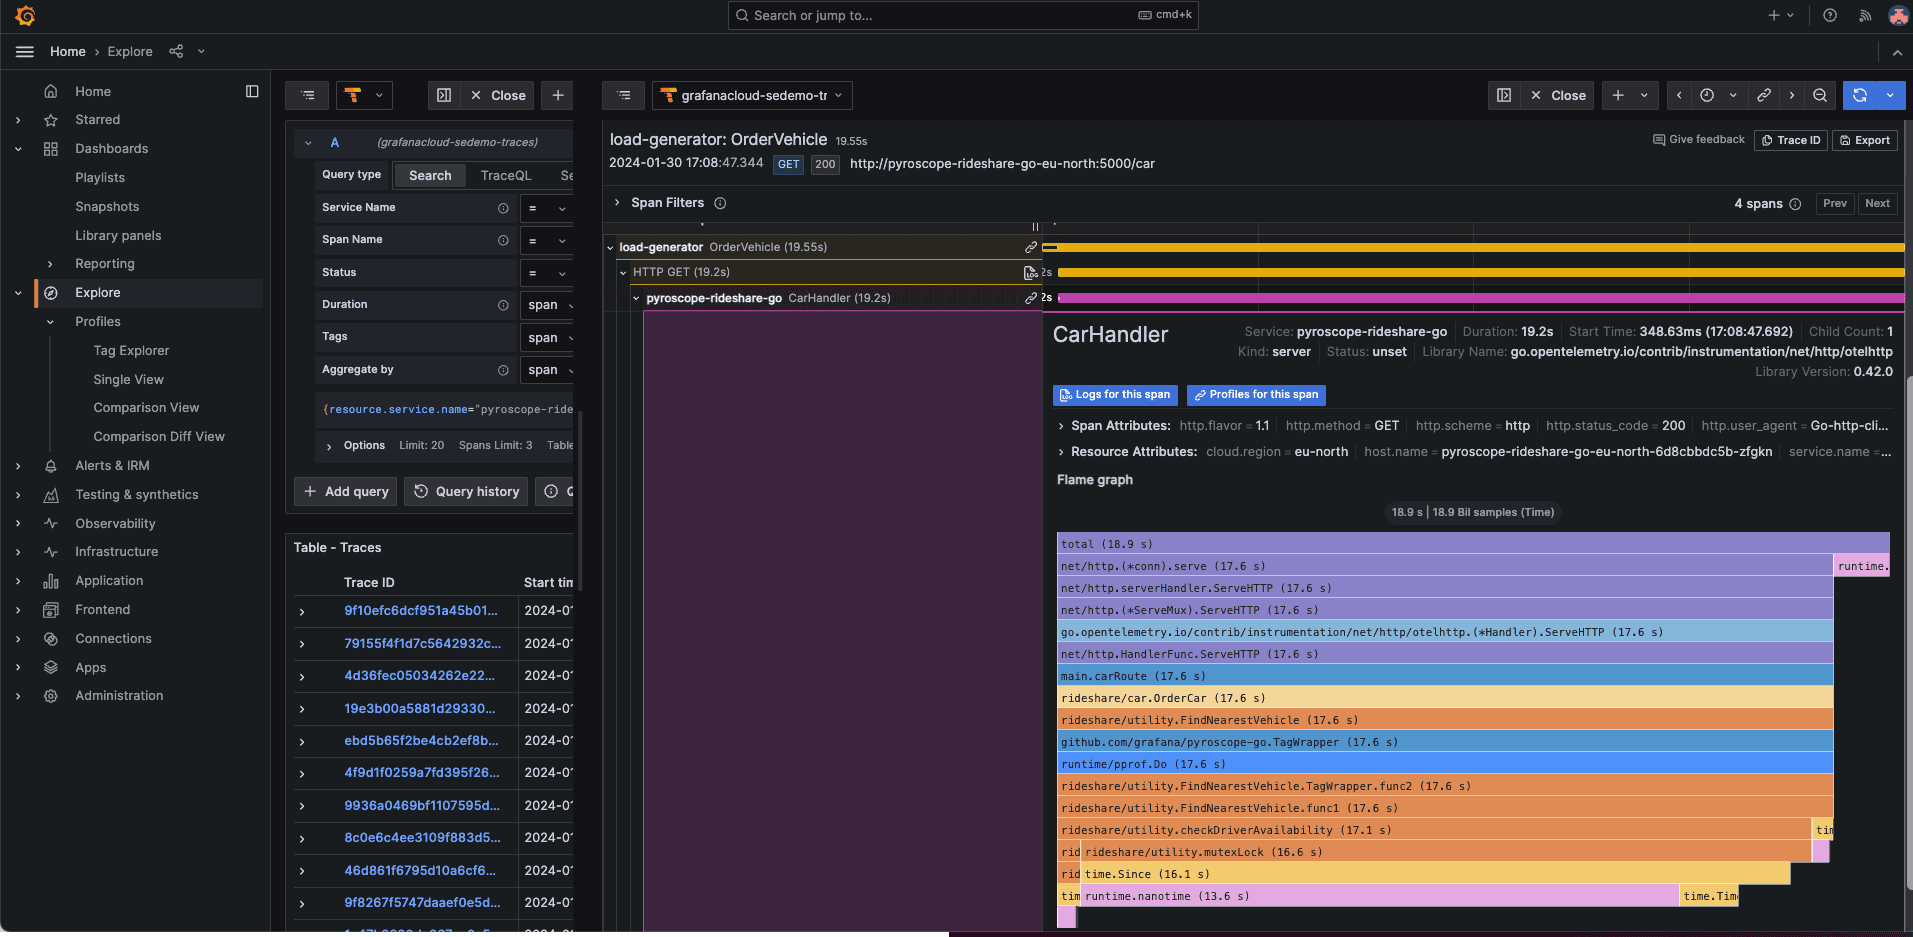
This targeted approach allows you to dissect performance metrics much more granularly than before. By zeroing in on individual requests or trace spans, Span Profiles provides a direct window into the most critical aspects of application performance.
The integration of Span Profiles with Grafana’s trace view creates a seamless experience for users. You can now transition effortlessly from a high-level trace overview to an in-depth analysis of a specific trace span. This feature also enriches the trace data with actionable insights, enabling faster and more effective performance tuning.
The business case for Span Profiles: efficiency and cost savings
The introduction of Span Profiles is not just a technical leap forward; there’s a great business and ROI case for the feature, as well.
By enabling teams to more quickly identify and resolve performance issues, Span Profiles reduces the time and resources spent on troubleshooting. This efficiency leads to significant cost savings, making Span Profiles a valuable tool to both optimize application performance and reduce operational costs.
A real-world example within Grafana Labs
To illustrate the business value of Span Profiles, here’s an example of how we’ve used the feature internally at Grafana Labs.
A few months ago, the team behind Grafana Pyroscope, the open source continuous database that powers Grafana Cloud Profiles, added our compactor component to the database architecture, providing major performance and cost benefits. The compactor increases query performance and reduces long-term storage usage by combining blocks. It plays a pivotal role in compacting multiple blocks into a single optimized block for each tenant, which not only reduces storage costs, but accelerates query speed.
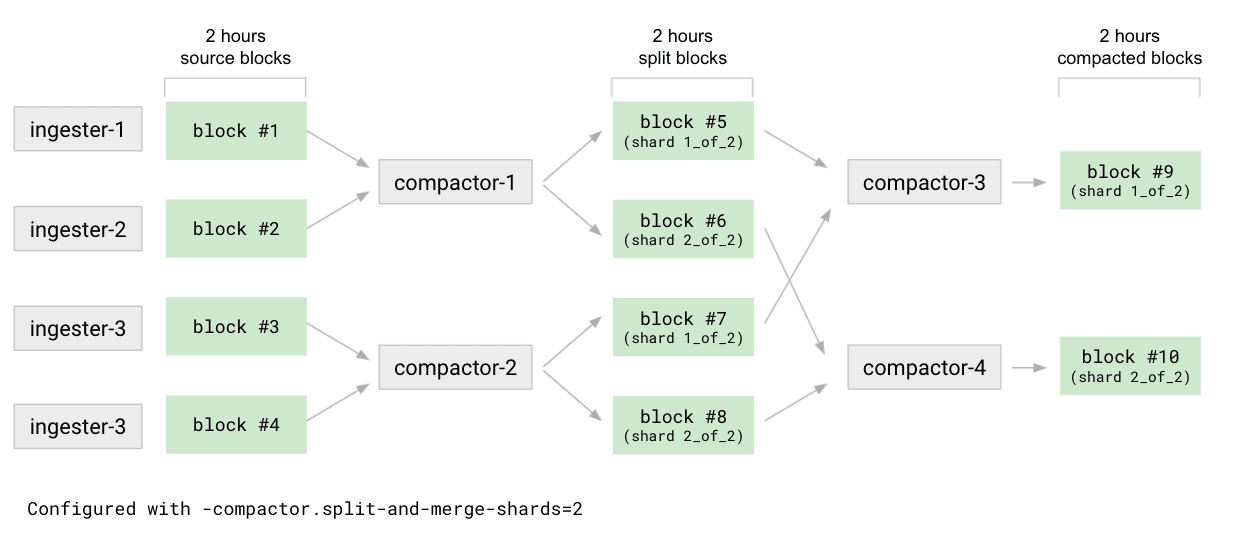
However, the complexity of the compaction process — which includes multiple stages, such as vertical and horizontal compaction, as well as split-and-merge strategies — introduced several challenges. Primarily, these challenges revolved around performance bottlenecks. For example, during intensive compaction operations, there could be significant CPU and memory usage spikes, as well as an increased demand on storage IO, leading to potential impacts on overall system stability. Additionally, managing and optimizing resources for large-scale compaction tasks, particularly in clusters with large tenants, was extremely complex. This is where the Span Profiles features showed its unique strengths.
By enabling detailed profiling of each compaction run, Span Profiles offered insights into CPU usage per function directly within the trace view. This level of detail, contextualized by the trace view, provided crucial information, such as the specific stages of the compaction process where bottlenecks occurred and the users affected by each compaction.

For instance, we discovered that level 1 compaction was a major bottleneck due to profiling symbols, and identified excessive block syncing during each run as another issue. Armed with this data, we made informed adjustments to our compaction algorithm. The impact was immediate and significant: compaction time was reduced 4x, and our API calls to object storage were slashed by 3x.

If we look solely at the reduction in GET requests, the savings are substantial. Considering Google Cloud Storage Class B/GET costs, the adjustments led to a monthly saving of approximately $8,000 (calculated as $0.0004 per GET request * 400 requests saved * 60 minutes * 24 hours * 31 days).
Elevate your profiling with Span Profiles
The Span Profiles feature marks a new chapter in application profiling. By offering detailed insights into specific execution scopes, it revolutionizes how performance issues are identified and resolved.
Span Profiles is available now in Grafana Cloud and Grafana 10.3. To learn more about the feature, you can check our technical documentation, along with these resources for getting started:
Grafana Cloud is the easiest way to get started with continuous profiling, metrics, logs, traces, and dashboards. We have a generous forever-free tier and plans for every use case. Sign up for free now!

