
Visualize Sumo Logic metrics and logs with Grafana: Introducing the Sumo Logic Enterprise plugin
We are thrilled to announce the addition of a powerful new Enterprise plugin in the Grafana ecosystem: the Sumo Logic Enterprise data source plugin for Grafana. You can now easily connect Sumo Logic to your Grafana instance and correlate your log data with telemetry from all your data sources in one unified Grafana dashboard.
Sumo Logic is the latest addition to our catalog of more than 20 Enterprise plugins, which includes ServiceNow, Splunk, Snowflake, Datadog, MongoDB, Oracle, New Relic, Dynatrace, Wavefront, and AppDynamics. All Enterprise plugins are available in Grafana Enterprise as well as across all tiers of Grafana Cloud, including our generous forever-free tier — an update we announced at GrafanaCON 2023. (If you don’t have a Grafana Cloud account, you can sign up for free today!)
The Sumo Logic Enterprise plugin is designed with simplicity in mind. After configuring the data source with a few easy clicks, you’ll be able to explore and visualize your Sumo Logic logs and metrics in Grafana. Grafana also provides annotations and alerting capabilities, allowing users to set up alerts based on both metrics and log data. This ensures timely notifications when certain conditions or patterns are detected.
With the Sumo Logic Enterprise plugin, you’ll also be able to unify log data with telemetry from other data sources to gain a centralized view of your system’s overall health and performance.
“Maintaining proper observability for modern, cloud native applications continues to grow in complexity as organizations are challenged with delivering seamless user experiences at a planetary scale. This is especially true for teams that need to unify telemetry from multiple observability tools or data lakes deployed across their organization,” says Drew Horn, Senior Director, Technology Alliances at Sumo Logic. “We’ve been working closely with the team at Grafana Labs and are excited about the launch of the Sumo Logic Enterprise plugin as a tool to help these teams democratize their data, derive highly contextual real-time insights, and ultimately simplify the troubleshooting process of their applications.”
What is Sumo Logic?
Sumo Logic is a cloud-based log management and analytics platform that helps organizations collect, analyze, and derive insights from their machine-generated data. This includes log data, metrics, and other types of data generated by applications, infrastructure, and security systems. Sumo Logic is designed to provide real-time visibility into an organization’s technology stack, helping users monitor, troubleshoot, and secure their systems. Sumo Logic also excels in real-time log monitoring, making it easier to detect and respond to issues as they occur. It supports the aggregation of logs from diverse environments, including cloud services, applications, and infrastructure.
Why use the Sumo Logic Enterprise plugin for Grafana?
The Sumo Logic Enterprise plugin has all the major features of our 20+ existing Enterprise plugins for Grafana, which include variables, complex annotations, alerting, access control, and permissions.
Using the Sumo Logic API, the Sumo Logic Enterprise plugin for Grafana allow users to query and visualize metrics and logs data to help with:
- Log management: Sumo Logic enables users to collect, index, and analyze log data from various sources, providing a centralized platform for managing logs. Now you can fetch both logs list as well as histogram buckets to get a better insight into your system’s behavior, performance and security.
- Metrics and monitoring: Sumo Logic supports the collection and analysis of metrics data, helping organizations monitor the performance of applications and infrastructure.
You can then easily build dynamic Grafana dashboards, such as this sample dashboard for monitoring system status below.
How to set up Sumo Logic with Grafana
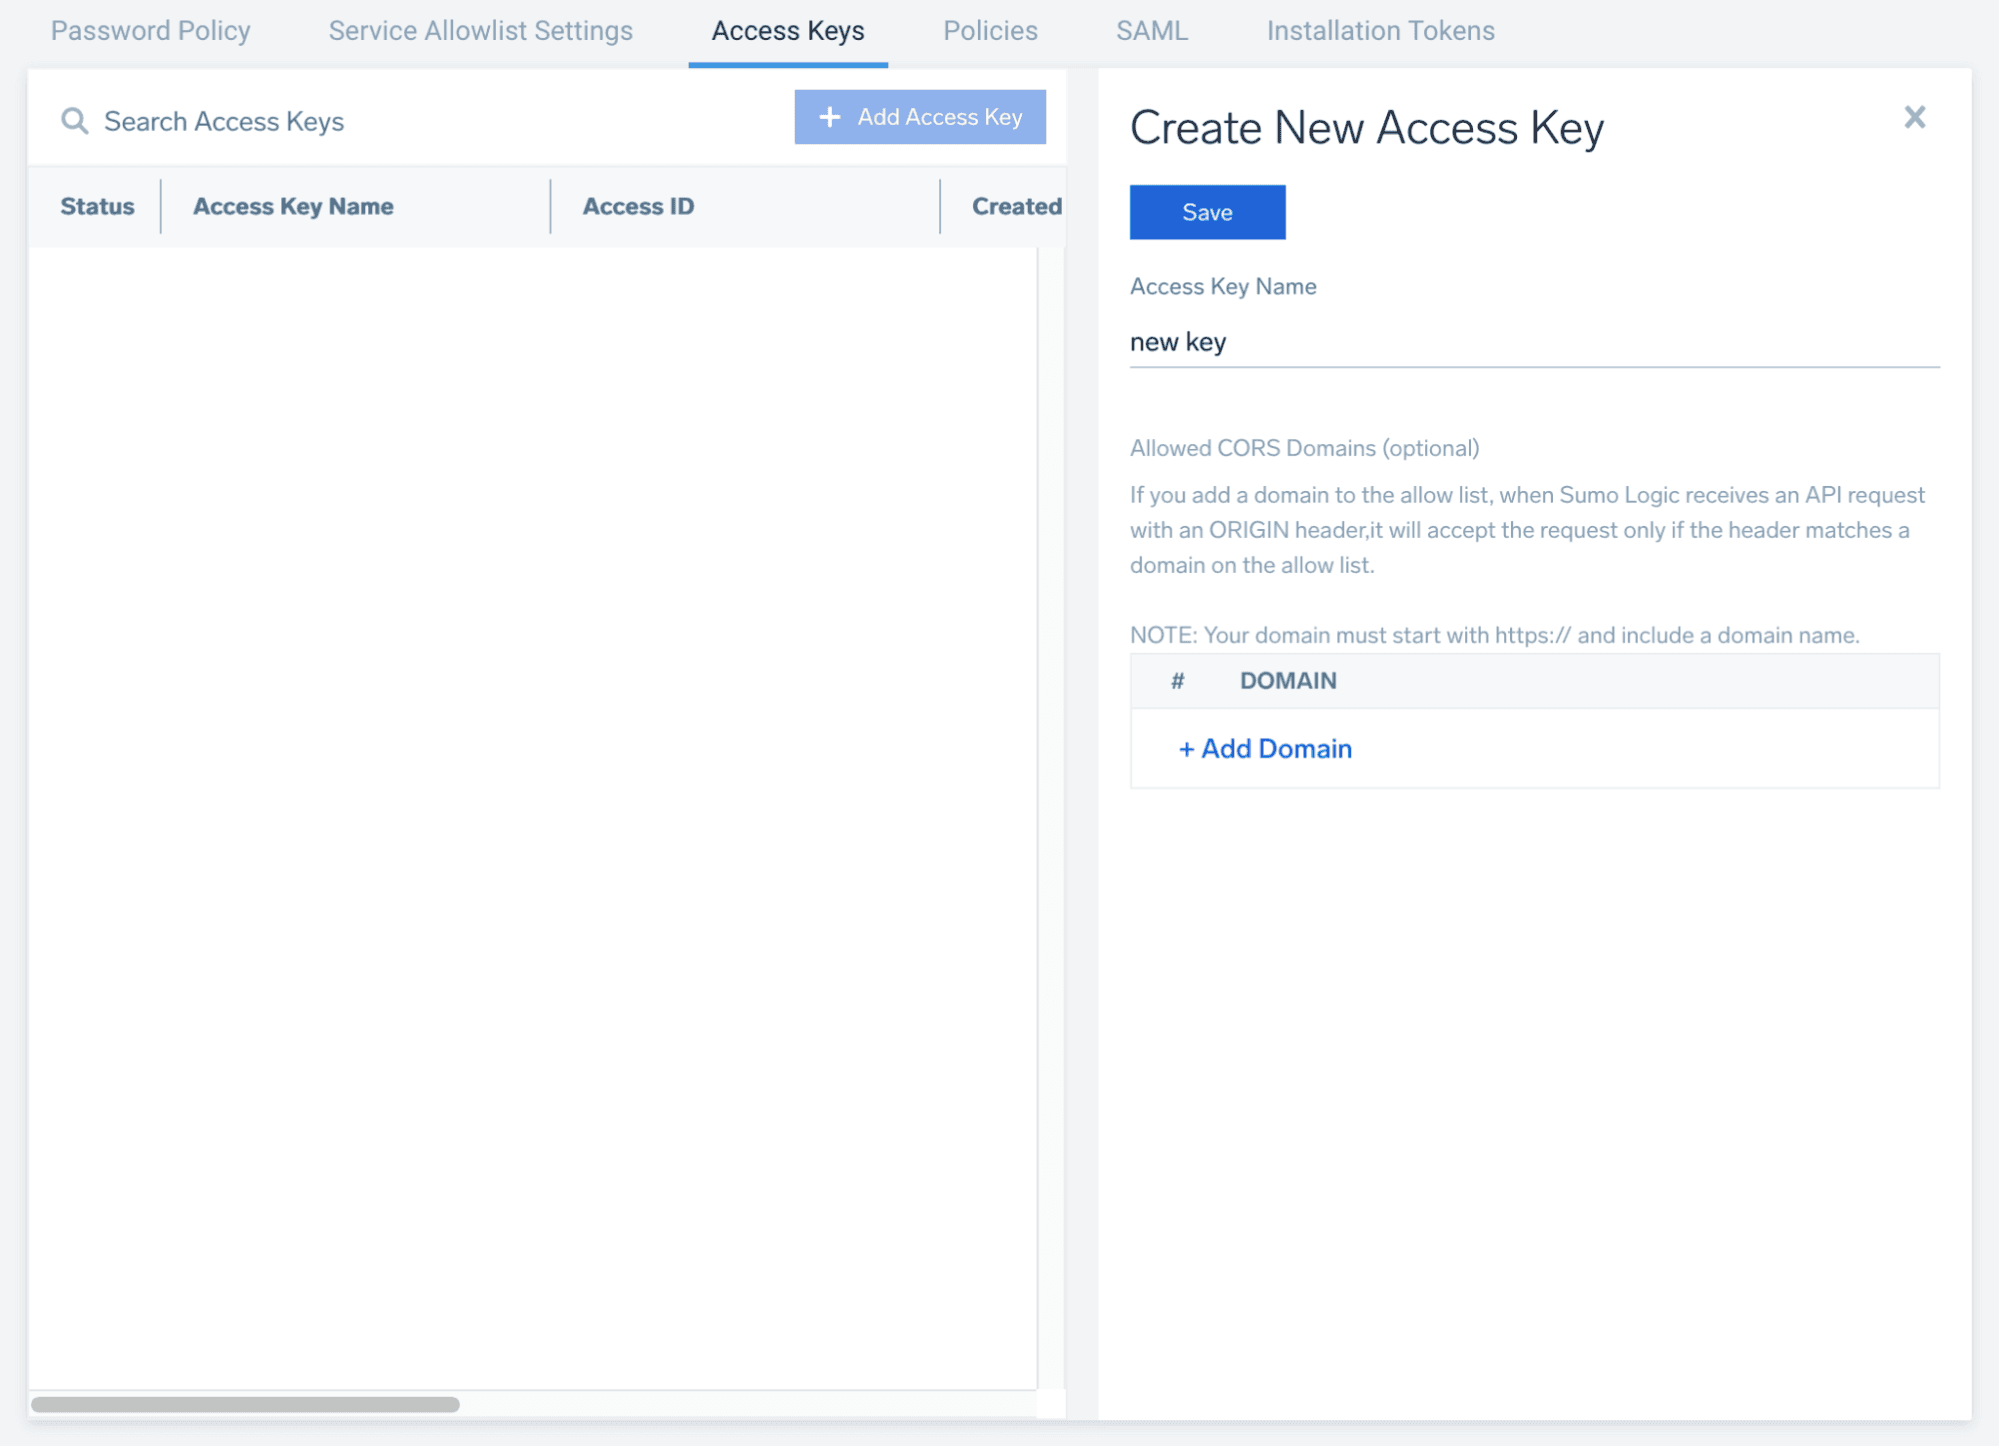
Setting up the Sumo Logic Enterprise plugin is simple and straightforward. Start by going to your Sumo Logic panel and creating a new Access Key and Access ID combination. (For more information, you can reference Sumo’s official Access Key tutorial.) Remember to copy and store the keys securely because they provide access to your Sumo Logic account.
Once the key is ready you will need to download and install the Sumo Logic Enterprise plugin for Grafana. (For more info about how to install a plugin, please see our data source plugin documentation.)
With the plugin installed, configure Sumo as a data source by going to Connections > Data sources > Add data source. Select SumoLogic and on the configuration page pick your API region from the dropdown (the Sumo Logic docs will help you find out which endpoint you should use), and provide the authentication credentials, which are the Sumo Logic Access Key and AccessID generated in the previous step.
Once all the fields are filled you can Save & test your new data source and a message should be displayed once you have successfully connected the data source.

How to use annotations for Sumo Logic data in Grafana
As mentioned before, the Sumo Logic Enterprise plugin supports annotations so let’s look into implementing this feature in a Grafana dashboard. The annotations overlay adds visual markers on your time series graphs whenever a correlated event happens and includes important context such as event descriptions and event tags. So let’s try adding one to a new panel.
Let’s start by creating a panel fetching some Sumo Logic metrics data for us.

Once we’re happy with our graph, let’s go to the Dashboard Settings > Annotations and add a New query. We will query the Sumo Logic logs data searching for error events that happened in our system and plot them on the metrics histogram.

Notice the Enabled toggle in the annotation config is checked. This will allow us to use the newly created annotation on our dashboard. Now let’s save it with Apply and go back to the dashboard to see the result.
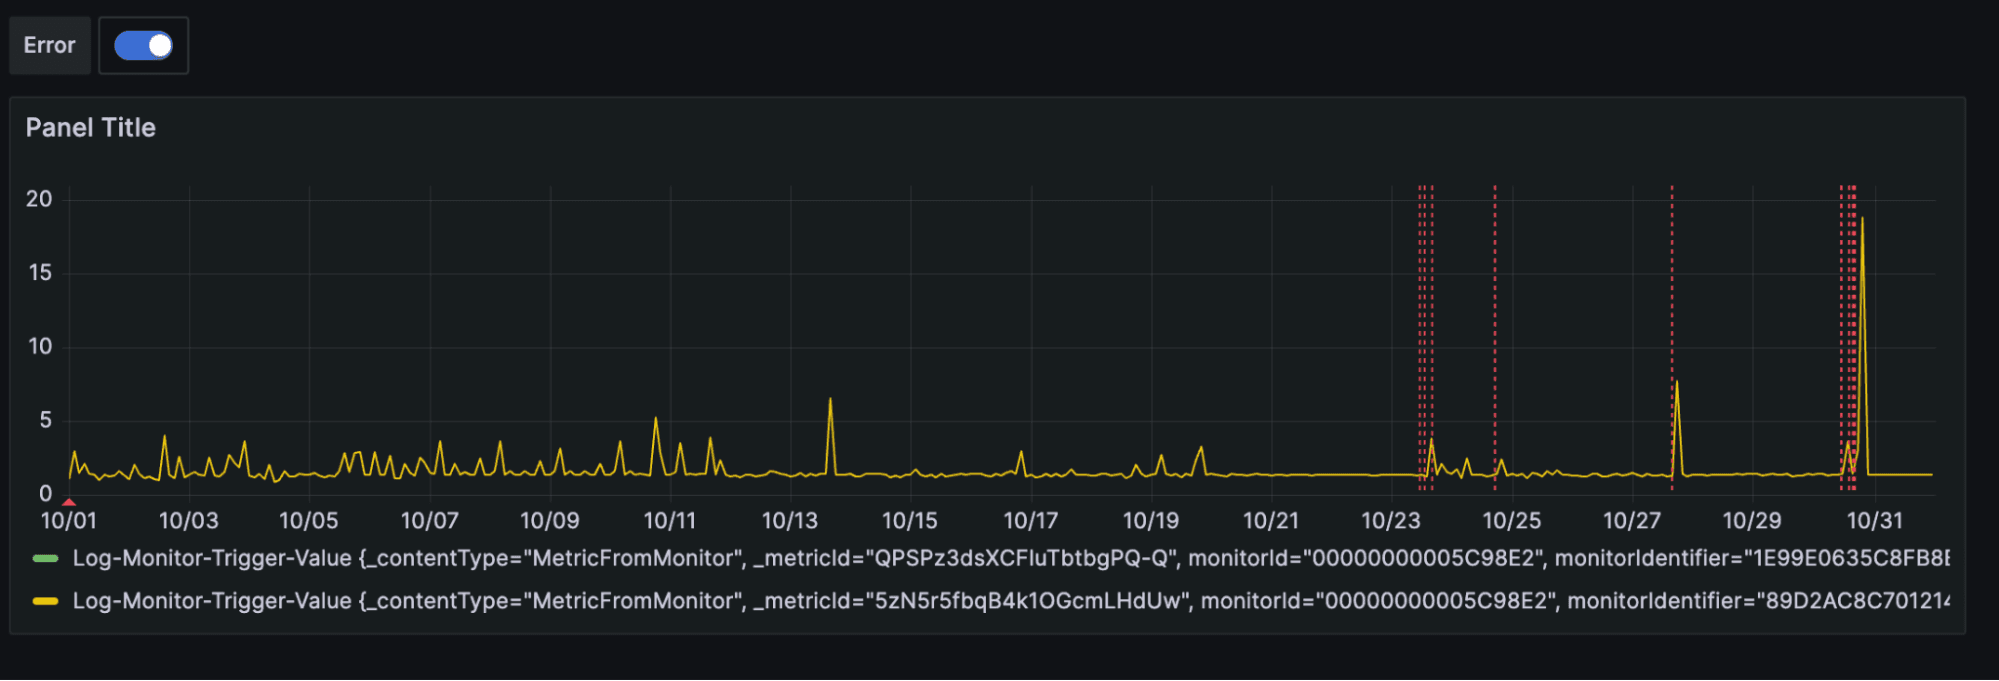
Voila! Now we have successfully plotted a line whenever an error happened.
To proactively detect such events in the future, we can use another supported feature, alerts, and set them up for our panels.
Learn more about Sumo Logic and Grafana
The Sumo Logic Enterprise plugin is fully supported by Grafana Labs and is available for all Grafana Enterprise and Grafana Cloud users, including those in our forever-free tier. To learn more, check out our Sumo Logic data source plugin documentation. You can also contact our team for more information.
We hope you’ll find many use cases for this new data source. As always, we look forward to hearing your feedback in our community forums and in the Grafana Labs Community Slack.
Grafana Cloud is the easiest way to get started with metrics, logs, traces, dashboards, and more. We have a generous forever-free tier and plans for every use case. Sign up for free now!

