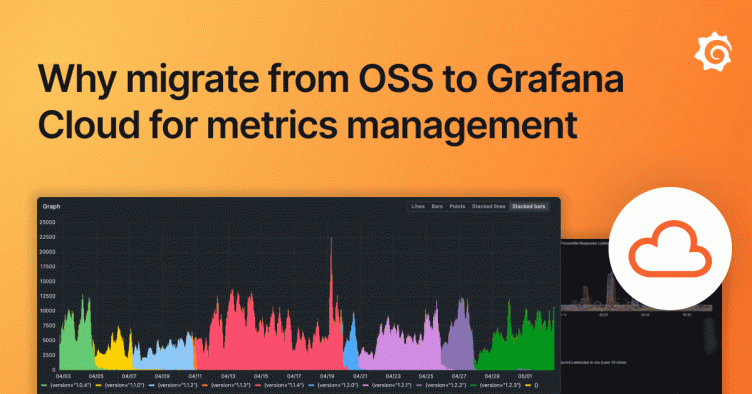
Why companies migrate from OSS to Grafana Cloud for metrics management
In 2022, we introduced Grafana Mimir, the most scalable and performant open source time series database in the world. And since its launch, we’ve been busy, increasing Mimir’s scale, making it easier to get started, and boosting query performance.
But even with these advancements, we understand the challenges that can come with a self-hosted and self-managed OSS tool.
“While we love open source, along the way we lost sight of what we set out to do in the first place — to make observability effective, self-service, and low cost,” wrote Oren Lion, Director of Software Engineering, Productivity Engineering at TeleTracking, in a recent blog post he co-authored with Tim Schruben, TeleTracking’s Vice President, Logistics Engineering. In the post, which focused on the company’s move from OSS to Grafana Cloud, Lion and Schruben noted, “As operations scaled, we [realized we needed] a managed solution.”
It’s this and similar realizations that prompt many observability teams to switch from OSS to Grafana Cloud Metrics, a fully managed, highly scalable metrics service in Grafana Cloud. In this post, we’ll explore some of the biggest benefits of migrating to Grafana Cloud for metrics — through the lens of four organizations who’ve already made the move.
1. Reduce metrics volume by 33% — and cut costs
Before migrating to Grafana Cloud Metrics, SailPoint, a leading provider of next-generation identity security solutions, faced some challenges with observability at scale — and the associated costs.
As the company’s Prometheus servers grew in size, they started to max out their AWS instances. The observability team horizontally scaled their infrastructure, first with Cortex and later with self-managed Grafana Mimir.
But when they assessed the total cost of ownership for their self-hosted metrics, accounting for both infrastructure costs and maintenance, they realized just how high their monthly spend had become. To combat this, they turned to Grafana Cloud Metrics.
“When we crunched the numbers, Grafana Labs was offering to run everything for cheaper, and it would reduce the load on our engineering team,” said Lopez. “That was our ‘a-ha’ moment.”
SailPoint also started to use Adaptive Metrics, the metrics management feature in Grafana Cloud that enables teams to aggregate unused and partially used metrics into lower cardinality versions to reduce costs. Within a few months of applying Adaptive Metrics suggestions, in conjunction with the internal efforts of their engineering team, SailPoint reduced their metrics volume by 33% — and suddenly found it much easier to keep their costs in check.
Even as SailPoint continues to scale and offer new services, “Adaptive Metrics really helps us to grow efficiently… without just blowing up our metrics and our costs,” said Lopez.
Read more about how SailPoint manages metric cardinality and costs with Grafana Cloud.
2. Spend more time on innovation and less time “babysitting” systems
Dapper Labs, the company that builds popular games and verifies authentic digital collectibles using blockchain technology, started its monitoring journey by running its own Prometheus instance as a data store, with Grafana OSS as the visualization layer. But as the company scaled, the SRE team found itself grappling with storage management and data retention.
“To spend time carefully managing where the storage goes, what our retention period is, and to make sure that the Prometheus node is beefy enough that we can actually do queries across the last six months of data … It was all a headache,” said the head of SRE at Dapper Labs at the time.
To eliminate these headaches, the SRE team turned to Grafana Cloud. And even as their products experienced a 100-fold increase in users, and their metrics ballooned from 200,000 to almost 4 million active series, the team benefited significantly from the time savings that came with the migration. At the time, there were only six people in the observability pod, but Grafana Cloud allowed the team to support a much larger engineering organization and focus on strategic projects — all without worrying about system maintenance and upgrades.
Said the Dapper Labs SRE lead: “Anything that requires babysitting is a lost opportunity cost for us."
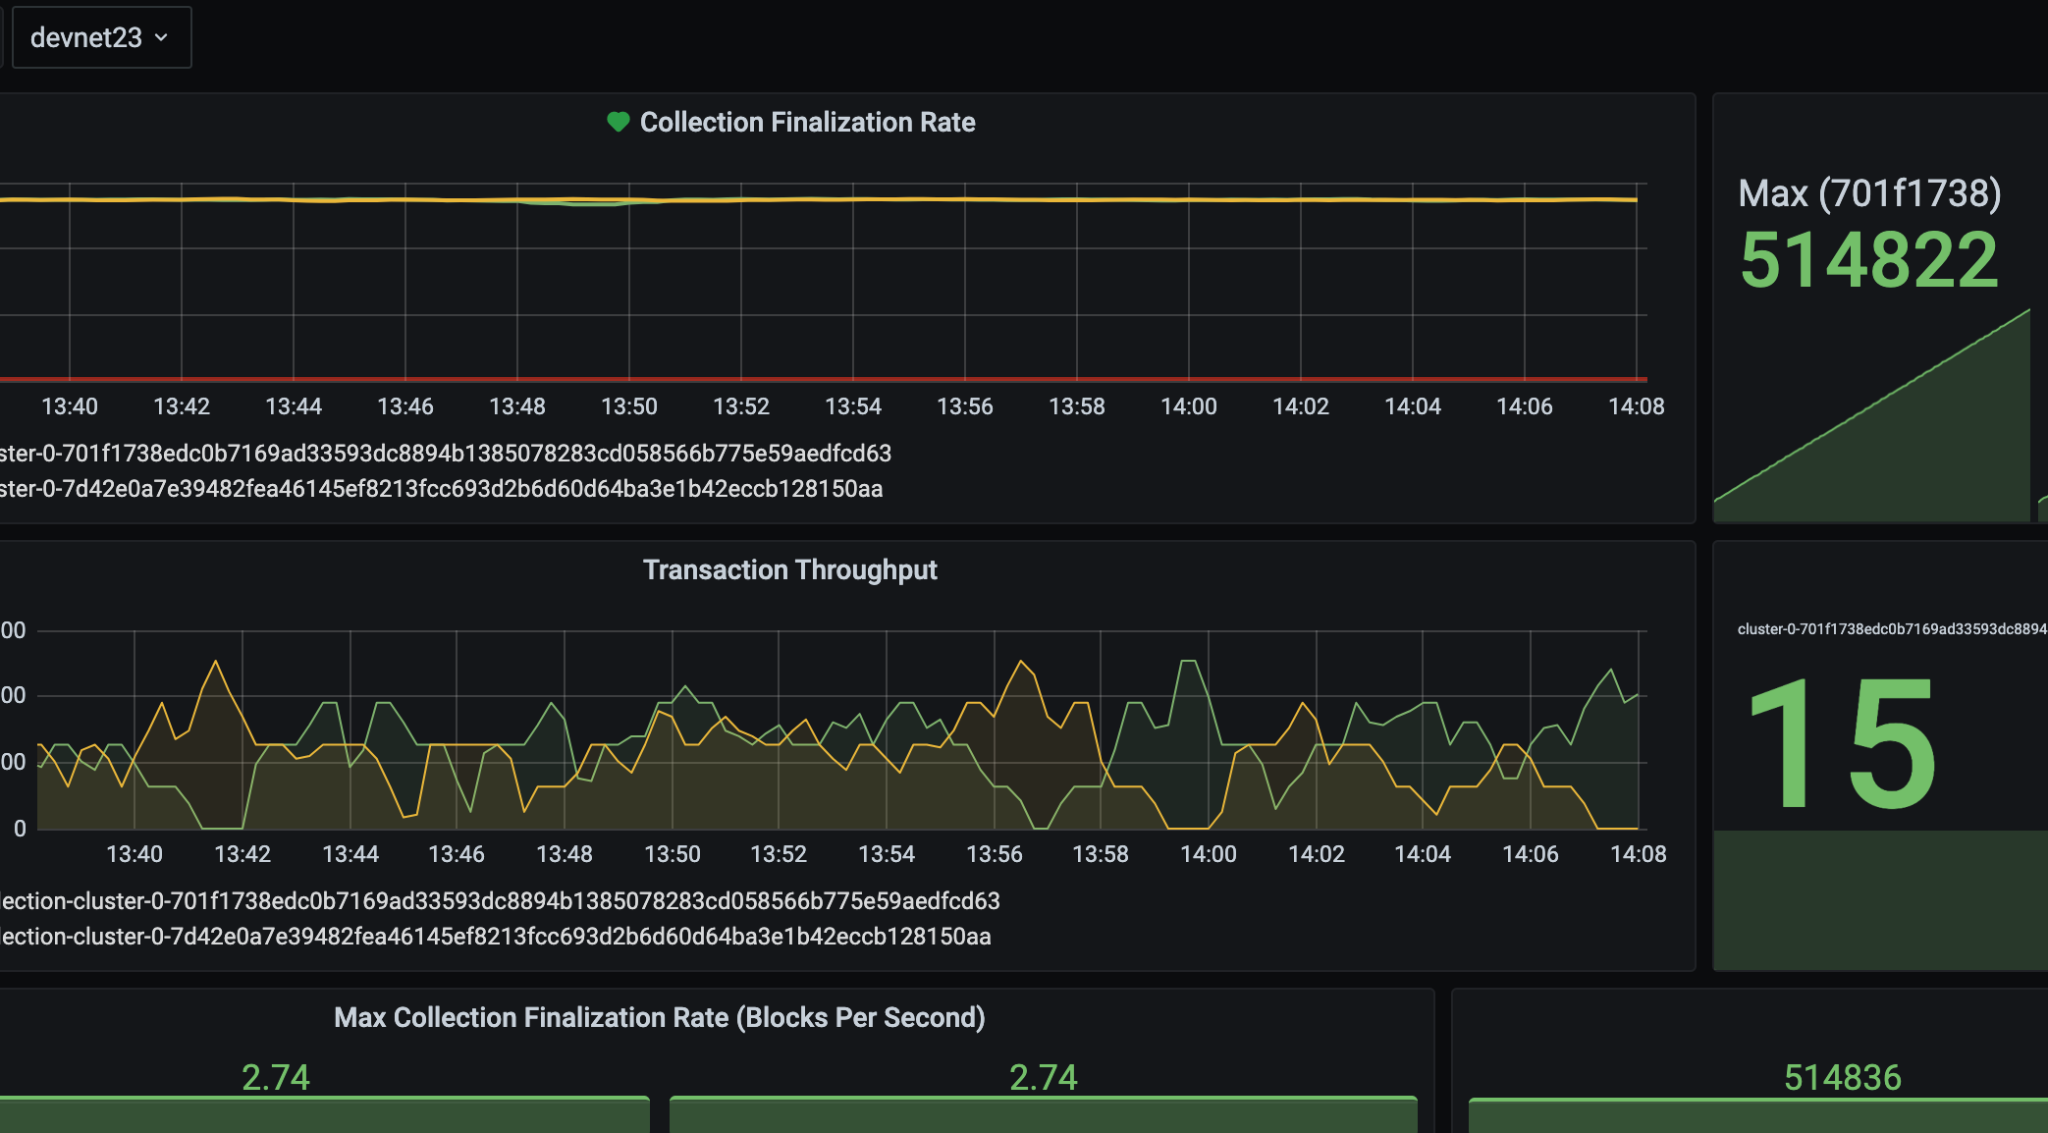
Learn more about how Dapper Labs transformed its observability strategy with Grafana Cloud.
3. Speed up queries and improve reliability
The Trade Desk, a technology company whose SaaS platform helps ad buyers create, manage, and optimize digital advertising campaigns, has grown significantly, in terms of both employee count and market cap, since it was founded in 2009.
To support that growth, the company operates at incredibly high scale, in terms of its global IT infrastructure. Before moving to Grafana Cloud, The Trade Desk hosted their own storage layer for their monitoring system, but that layer was difficult to scale, to support, and, in the end, not always reliable.
“Often, individual nodes would run out of storage or, due to the technology’s single-threaded nature, would get overloaded,” said Carl Johnson, who is now the Senior Director, Production Engineering at The Trade Desk. “Developers and people at the company were just exasperated and annoyed with the unreliability of getting queries to complete or with missing metrics.”
The Trade Desk was already using Grafana for visualizations, and members of the SRE team knew Grafana Labs also offered backend storage through Grafana Cloud. After a successful POC and trial run, the team decided to migrate — and quickly reaped the benefits.
“Query time immediately improved and many, many developers seemed to notice. Also, our reliability improved quite a bit,” said Patrick O’Brien, who is now the Lead Staff Software Engineer, SRE at the company.
The shift also resulted in fewer complaints and less troubleshooting for the engineering team, said Johnson. “Metrics usage frustration improved nearly overnight once we went with the hosted platform.”
Query time immediately improved and many, many developers seemed to notice. Also, our reliability improved quite a bit.
-Patrick O’Brien, now Lead Staff Software Engineer, SRE at The Trade Desk.
Read more about how The Trade Desk used Grafana Cloud to make their monitoring system faster, easier, and more reliable.
4. Centralize and streamline your observability approach
TeleTracking, an integrated healthcare operations platform provider, has a unique observability story to tell. The company migrated from a SaaS observability tool to OSS — a mix of Grafana, Prometheus, and Thanos — to gain a global view of its services, which ran on various cloud resources within both AWS and Microsoft Azure.
But as the company’s operations scaled, they found themselves looking for a more efficient and cost-effective observability solution. So, they pivoted back to a SaaS tool — this time, to Grafana Cloud for metrics and logs, which they use today alongside Prometheus, to create a modern, centralized observability stack.
“These tools not only give us greater visibility into our services, but serve as key feedback mechanisms for an ever-evolving developer experience,” wrote Oren Lion, Director of Software Engineering, Productivity Engineering at TeleTracking, in a recent blog post he co-authored with Tim Schruben, TeleTracking’s Vice President, Logistics Engineering.
TeleTracking was especially drawn to the centralized approach of Grafana Cloud Metrics, which uses a remote-write model, and the ability to visualize metrics and logs, side-by-side, in a Grafana dashboard.
The team also implemented Adaptive Metrics, after noticing that each new service or exporter would increase their spending. Ultimately, with this move, they were able to reduce their spend on Grafana Cloud Metrics by 50%.
With Adaptive Metrics, “we can increase metric verbosity when actively debugging and need labels that provide granular detail,” Schruben wrote. “And when we are done debugging, Adaptive Metrics allows us to revert to less verbose metrics by re-aggregating labels.”

Learn more about TeleTracking’s observability journey with Grafana Cloud.
Grafana Cloud is the easiest way to get started with metrics, logs, traces, and dashboards. We have a generous forever-free tier and plans for every use case. Sign up for free now!

