How to improve your observability strategy: Introducing the Observability Journey Maturity Model
While many segments of the IT market move quickly, the observability space seems to move at lightning speed. Fueled by open source innovation, observability toolsets and best practices constantly evolve. Sometimes, it can be tough to keep up — and even tougher to know where your own observability strategy stands.
That’s the exact challenge we aim to address with our new Observability Journey Maturity Model. Through a series of questions, the model encourages organizations to reflect on, and continually improve, the tools, teams, and processes that drive their observability strategy.
Grafana Labs started building the Observability Journey Maturity Model in collaboration with a Grafana Cloud user who was looking for a way to measure the effectiveness of their observability practice. In particular, the company wanted a tool to help identify the strengths — and enablement gaps — across the 29 distinct services teams supporting their Cloud Contact Center Solutions.
After rolling out the assessment and collecting responses from the team leads within each of those 29 groups, they were able to achieve that comprehensive, high-level view they were hoping for.
“It’s a really great tool to get an understanding of the overall state of our observability implementation,” said Valentin Martinjuk, Senior Manager, SRE at the company. “I’ve been really impressed with the insights, and that we can see insights by team. It’s just enough granularity to make some decisions — and make some improvements.”
How the Observability Journey Maturity Model works
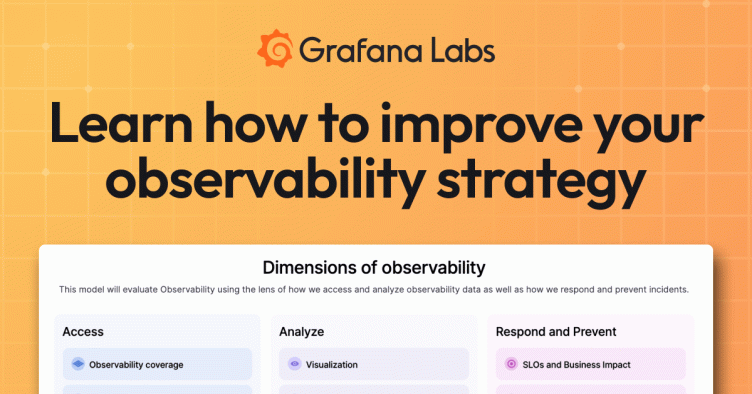
The Observability Journey Maturity Model, which is now publicly available, evaluates observability maturity through three lenses:
- Access: How an organization accesses observability data
- Analyze: How the organization analyzes that data
- Respond and prevent: How they handle incidents
Within those three broad topics, the assessment hones in on 9 key dimensions related to observability:

So, for example, “Observability coverage” (under Access) helps gauge the value of the observability signals you’re collecting, while “Visualization” (under Analyze) helps assess how well you can visualize data from a variety of data sources in one, centralized location. (For more details on the 9 dimensions used in the model, check out this page).
Observability maturity model results: insights and improvements
After completing all the questions in the model, your organization is assigned one of three maturity levels — Reactive, Proactive, or Systematic — based on the information you provide:

But the results of the assessment tell you so much more than your overall maturity level. They also help you identify the specific areas in which your observability practice excels, as well as areas for improvement. Just as importantly, the model provides recommendations and resources to address those areas that may be lagging.
The Grafana Cloud user mentioned above, for example, was able to determine that they excel in areas like correlation, root cause analysis, and incident management response. But they also identified some gaps. In particular, they learned that some of their services teams lacked a clear picture of their observability spend and resource consumption — some of those who took the assessment said they are not proactively notified when usage thresholds are met.
Now, armed with these insights, they’re actively working to improve cost allocation practices across the organization.
“With the help of Grafana, we’ve released billing dashboards and cost breakdown dashboards, and announced to our internal teams that they can use these dashboards to understand their spending and resource consumption,” said Kirill Demkin, Manager, Development, Cloud SRE at the company.
What’s more, organizations can use the Observability Journey Maturity Model as a benchmark to measure their observability maturity over time. In the case of the Grafana Cloud user mentioned here, they plan to take the assessment annually — not only to track their own progress and growth, but to demonstrate their ongoing value to leadership and other key stakeholders.
“This is a really good way to present the results of your work to your managers or top-level managers,” said Martinjuk. “The results are visual and understandable, even for non-technical teams.”
Learn about your organization’s observability maturity
The Observability Journey Maturity Model is free and open to anyone to complete. The results are provided immediately on the site and can be sent via email.
A few other helpful details to know:
- We ask each user to provide your name, company name, and email. However, you will not be added to Grafana Labs marketing campaigns and you can choose whether you want Grafana Labs to contact you.
- You can request to talk to a member of the Grafana Labs team to learn more about your observability maturity model results and discuss the best next steps.
- Grafana Labs may use anonymized data for assessing and publishing industry-specific and general trends in observability.
To learn more about your organization’s observability maturity, take the assessment today!


