
Grafana Beyla 1.2 release: eBPF auto-instrumentation with full Kubernetes support
We’re excited to announce that with the release of Grafana Beyla 1.2, Kubernetes support is now fully integrated.
With this update, the Grafana Beyla configuration now “understands” Kubernetes semantics to provide a more fine-grained selection of services to instrument. Beyla users can decorate metrics and traces with the metadata of Kubernetes entities, such as pods and deployments, that run the automatically instrumented services. Before the Beyla 1.2 release, users who wanted to enrich their metrics and traces with Kubernetes metadata had to set up an intermediate OpenTelemetry collector. Overall, this update allows for a richer experience when visualizing and querying your metrics and traces.
At the same time, DaemonSet has become the preferred deployment mode for Beyla. Thanks to the versatility of the new service selectors, a user can precisely define which services need to be instrumented and which don’t. A single instance of Beyla will be able to instrument the selected group of services within a single Kubernetes node.
In this post, we’ll take a closer look at these new features and how to use them to select which services to auto-instrument based on their Kubernetes attributes. We’ll also walk through how your traces become decorated with the metadata of Kubernetes entities.

Note: To learn more about Grafana Beyla 1.2, you can check out our Beyla technical documentation and release notes.
Beyla service selectors
A service selector is a set of properties that tells Beyla which processes to instrument.
When Beyla is deployed as a regular operating system process that instruments other processes, the unique service selectors are the network port on which the instrumented process is listening on (which can be specified with the BEYLA_OPEN_PORT environment variable), or a regular expression to match against the executable file name of the process to instrument (BEYLA_EXECUTABLE_NAMEenvironment variable).
To select multiple groups of processes, the Beyla YAML configuration file format provides a discovery.services section, which accepts multiple selector groups:
discovery:
    services:
        # Instrument any process using the ports from 8080 to 8089
        - open_ports: 8080-8089
        # Instrument any process whose executable contains "http"
        - exe_path: "http"
        # Instrument any process with an executable containing "nginx"
        # and using the port 443 (both conditions must be fulfilled)
        - open_ports: 443
          exe_path: "nginx"
The above criteria are insufficient for Kubernetes pods, where often the service ports are ephemeral and internal to the pods. Also, Kubernetes pods involve a level of abstraction that typically hides details, such as the name of the service executables. Beyla 1.2 is fully Kubernetes-ready, and introduces Kubernetes-specific service selection criteria. All of the following new selection criteria accept a Go RE2-syntax regular expression as value:
k8s_namespace: only instrument applications in the namespace matching the provided regular expression.k8s_deployment_name: only instrument pods that belong to a deployment with a name matching the provided regular expression.k8s_replicaset_name: only instrument pods that belong to a ReplicaSet with a name matching the provided regular expression.k8s_pod_name: only instrument pods with a name matching the provided regular expression.
Example scenario
1. Deploy instrumentable services
You can instrument any HTTP or HTTPS service in your Kubernetes cluster. If you prefer, you can first try instrumenting the dummy services provided in this example.
The following Kubernetes example file contains two Apache HTTP servers: one pretends to be for a company website and the other pretends to be for a documentation site (docs). Both servers will just return an “It Works!” string when the root directory is requested, and a 404 error if any other path is requested.
Copy the following contents into a file (for example,sampleapps.yml) and deploy it with the command kubectl apply -f sampleapps.yml.
kind: Deployment
apiVersion: apps/v1
metadata:
    name: docs
spec:
    replicas: 2
    selector:
        matchLabels:
            app: docs
    template:
        metadata:
            labels:
                app: docs
        spec:
            containers:
                - name: docs-server
                  image: httpd:latest
                  ports:
                      - containerPort: 80
                        protocol: TCP
                        name: http
---
apiVersion: v1
kind: Service
metadata:
    name: docs
spec:
    selector:
        app: docs
    ports:
        - protocol: TCP
          port: 80
---
kind: Deployment
apiVersion: apps/v1
metadata:
    name: website
spec:
    replicas: 2
    selector:
        matchLabels:
            app: website
    template:
        metadata:
            labels:
                app: website
        spec:
            containers:
                - name: website-server
                  image: httpd:latest
                  ports:
                      - containerPort: 80
                        protocol: TCP
                        name: http
---
apiVersion: v1
kind: Service
metadata:
    name: website
spec:
    selector:
        app: website
    ports:
        - protocol: TCP
          port: 80
To test that the services are up and running, open two terminal sessions and run one of each command below on a different session:
# Redirect website to local port 8080
kubectl port-forward services/website 8080:80

# Redirect docs site to local port 8081
kubectl port-forward services/docs 8081:80
From your computer, each request to http://localhost:8080 will be a hypothetical request to the company website and each request to http://localhost:8081 will be a hypothetical request to the documentation website. You can use a simple curl command to the URLs above to verify that your services are up and running.
2. Create a beyla namespace
Before configuring and deploying Beyla, let’s create a beyla namespace. We will use it to group all the required permissions, configurations, and deployment options:
kubectl create namespace beyla
3. Get Grafana Cloud credentials
Beyla can export metrics and traces to any OpenTelemetry endpoint, as well as expose metrics as a Prometheus endpoint. Check out our documentation for more information about how to select the different exposition protocols.
In this blog post, we’ll use the OpenTelemetry endpoint in Grafana Cloud to get started as quickly as possible. (If you don’t already have Grafana Cloud, you can sign up for a free account today.)
From the Grafana Cloud portal, look for the OpenTelemetry box and click Configure.

Under Password/API Token, click Generate now and follow the instructions to create a default API token.
The Environment Variables will be populated with a set of standard OpenTelemetry environment variables, which will provide the connection endpoint and credentials information for Beyla.

From the Environment Variables section, copy the OTEL_EXPORTER_OTLP_ENDPOINT and OTEL_EXPORTER_OTLP_HEADERS values and create a new secret from them. For example, create the following secret file and apply it:
apiVersion: v1
kind: Secret
metadata:
    namespace: beyla
    name: grafana-credentials
type: Opaque
stringData:
    otlp-endpoint: "https://otlp-gateway-prod-eu-west-0.grafana.net/otlp"
    otlp-headers: "Authorization=Basic ...rest of the secret header value..."
4. Configure and run Beyla
Next, you need to provide Beyla with permissions to watch and inspect the metadata of the diverse Kubernetes resources, which Beyla’s discovery mechanism requires. To do this, create and apply the following YAML file:
apiVersion: v1
kind: ServiceAccount
metadata:
    namespace: beyla
    name: beyla
---
apiVersion: rbac.authorization.k8s.io/v1
kind: ClusterRole
metadata:
    name: beyla
rules:
    - apiGroups: ["apps"]
      resources: ["replicasets"]
      verbs: ["list", "watch"]
    - apiGroups: [""]
      resources: ["pods"]
      verbs: ["list", "watch"]
---
apiVersion: rbac.authorization.k8s.io/v1
kind: ClusterRoleBinding
metadata:
    name: beyla
subjects:
    - kind: ServiceAccount
      name: beyla
      namespace: beyla
roleRef:
    apiGroup: rbac.authorization.k8s.io
    kind: ClusterRole
    name: beyla
And now, deploy Beyla by creating the following Kubernetes entities:
- A
ConfigMapstored in thebeyla-config.ymlBeyla configuration file, which defines the service discovery criteria. To ensure Beyla is able to discriminate by service instance, even if the instances run the same image and executable, Beyla is configured to select ONLY thedocsApache web server. - A Beyla
DaemonSet, which provides the Beyla pod and its configuration:- Loads the
beyla-config.ymlfile from theConfigMap, as specified inBEYLA_CONFIG_PATH. - References the
grafana-secretsvalues for the endpoint and credentials. - Uses the
beyla ServiceAccountto get all the permissions.
Copy and deploy the following YAML file:
apiVersion: v1
kind: ConfigMap
metadata:
    namespace: beyla
    name: beyla-config
data:
    beyla-config.yml: |
        # this is required to enable kubernetes discovery and metadata
        attributes:
          kubernetes:
            enable: true
        # this will provide automatic routes report while minimizing cardinality
        routes:
          unmatched: heuristic
        # let's instrument only the docs server
        discovery:
          services:
            - k8s_deployment_name: "^docs$"
            # uncomment the following line to also instrument the website server
            # - k8s_deployment_name: "^website$"
---
apiVersion: apps/v1
kind: DaemonSet
metadata:
    namespace: beyla
    name: beyla
spec:
    selector:
        matchLabels:
            instrumentation: beyla
    template:
        metadata:
            labels:
                instrumentation: beyla
        spec:
            serviceAccountName: beyla
            hostPID: true # mandatory!
            volumes:
                - name: beyla-config
                  configMap:
                      name: beyla-config
            containers:
                - name: beyla
                  image: grafana/beyla:1.2
                  securityContext:
                      privileged: true # mandatory!
                  volumeMounts:
                      - mountPath: /config
                        name: beyla-config
                  env:
                      - name: BEYLA_CONFIG_PATH
                        value: /config/beyla-config.yml
                      - name: OTEL_EXPORTER_OTLP_ENDPOINT
                        valueFrom:
                            secretKeyRef:
                                name: grafana-credentials
                                key: otlp-endpoint
                      - name: OTEL_EXPORTER_OTLP_HEADERS
                        valueFrom:
                            secretKeyRef:
                                name: grafana-credentials
                                key: otlp-headers
A couple important things to note:
- To run in DaemonSet mode, Beyla requires access to all of the processes in the node. This is why the Beyla pod needs to be run with
hostPID: true. - The Beyla container needs to run with
privileged: trueso it can perform privileged actions, such as loading eBPF programs and creating eBPF maps.
5. Test your instrumented services and see the results in Grafana
With the kubectl port-forward commands from the first step still running, test both web server instances. For example:
curl http://localhost:8080
curl http://localhost:8080/foo
curl http://localhost:8081
curl http://localhost:8081/foo
Some requests will return a 404 error, but that’s okay because those requests are also instrumented.
Now, go to the instance in Grafana Cloud, and from the Explore section in the left panel, select the data source for the traces (usually named grafanacloud-<your user name>-traces).

To search for all the traces, select the Search box in the Query bar, leave the form empty, and click Run query:

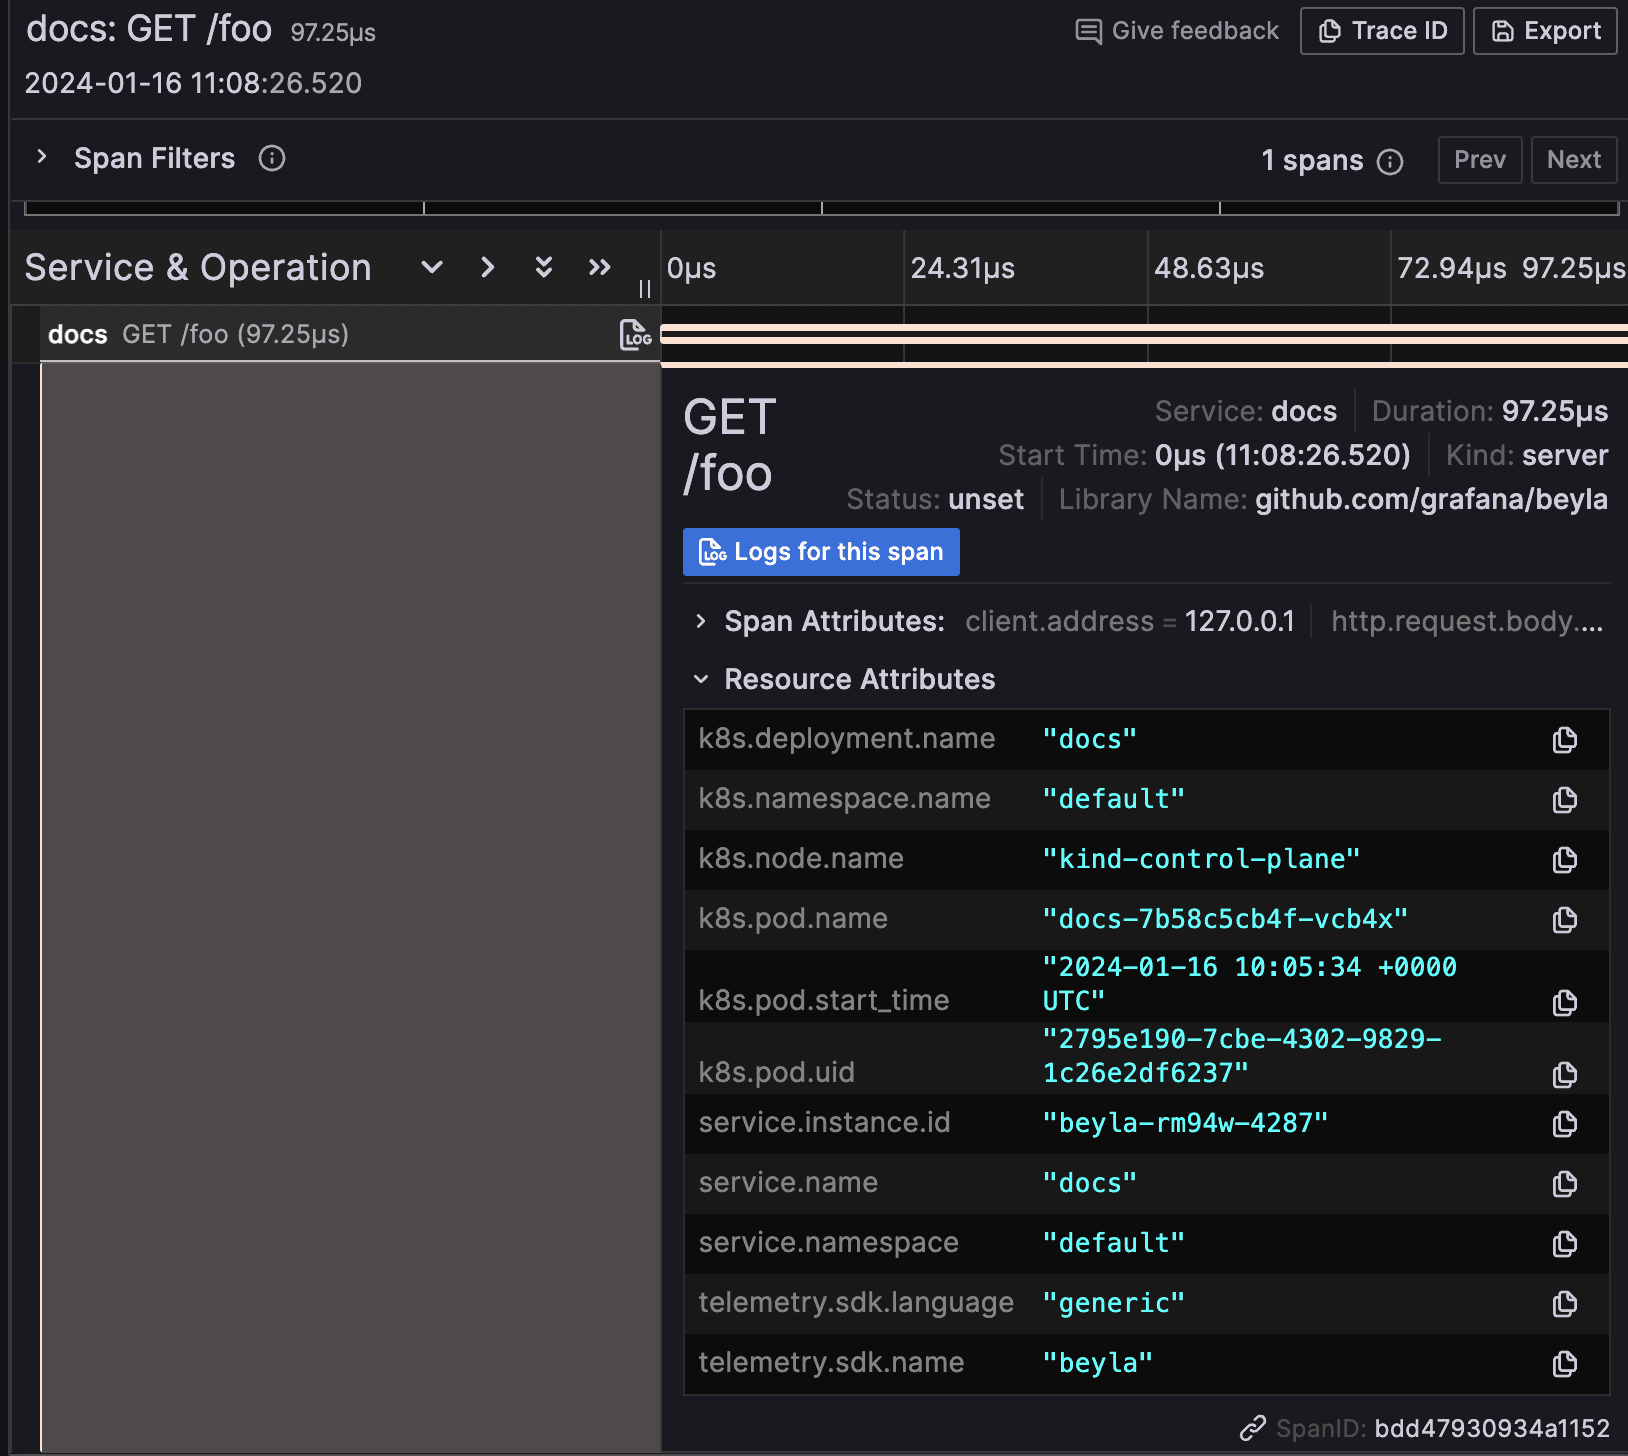
This will show the traces for the docs instance (port 8081). You might see traces from your own services, but shouldn’t see traces from the website service, as it has not been instrumented by Beyla.

If you expand the trace details, you will also see that the resource attributes in the traces are decorated with the metadata of the Kubernetes pod running the instrumented service. The Kubernetes trace attributes are all prefixed with k8s, as seen in the example below:
Grafana Beyla 1.2: closing thoughts
While Beyla 1.0 was functional with Kubernetes, early adopters asked for better integration mechanisms to smoothen operations — and that’s what we aimed to deliver with Beyla 1.2.
With integrated Kubernetes attribute selectors, Beyla users can now precisely select which pods to instrument without having to specify low-level details, such as process names or port ranges.
In addition, the decoration of metrics and traces with Kubernetes metadata allows for better identification of the instrumented applications, as you can now group them by pod and deployment. Overall, Grafana Beyla 1.2 represents a big step forward in the simplification of its deployment.
To learn more about Kubernetes support in Grafana Beyla 1.2, you can check out our documentation on Beyla configuration options and running Beyla as Kubernetes DaemonSet.

