Incident response that's fast and cost-effective: Why these 3 companies chose Grafana Cloud
When an incident occurs, every second counts. On-call staff need to quickly get all the relevant information in front of them in a way that’s easy to digest so they can more successfully investigate the issue and communicate with relevant stakeholders.
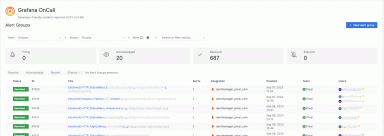
Grafana Cloud’s Incident Response & Management (IRM) suite helps teams do just that, bundling Grafana Alerting, Grafana OnCall, Grafana Incident, and Grafana SLO into one stack to detect issues, escalate alerts to the right team, automate essential tasks, and identify actionable insights. Moreover, it’s all presented using the same Grafana dashboards your developers and engineers already know and love.
“Grafana IRM makes it clear what the process is, and it’s very clear where to go and what to do,” said Paul Shahid, a senior infrastructure engineer at Clearco. “It cuts down on confusion during a time where stress levels can be high, and it gives everyone a clear, common process to gather information while working towards a resolution.”
Here, observability pros from three companies share how they have improved their incident response with Grafana IRM and how they saved time and money, not to mention their engineers’ sanity along the way.
1. Clear communication and action plan during incidents
Incidents are inevitable, but the engineers at Clearco, the world’s largest e-commerce investor, were finding out about them in the worst way possible — from the company’s customers. Realizing they needed to update their alerting strategy, they opted for Grafana Cloud because they were already using Grafana for dashboards and they wanted Grafana Cloud to be their single source of truth.
Six months after implementing Grafana IRM, the entire 40-person engineering team was actively using Grafana Cloud. They had also instituted automation to accelerate responses, reduced alerting fatigue, and leveraged Grafana’s ability to synthesize all the necessary information in one place.
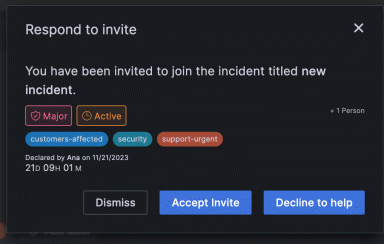
“Before we had Grafana Cloud and before we used Grafana Incident, it was unclear what had to happen when someone noticed that there was an actual problem,” Shahid said. “Now what typically happens is that an outage or an incident starts to happen, and then right away someone goes and creates a Grafana Incident page. That creates a Slack channel, a Google Meet, and it automatically generates a postmortem.”

Learn more about why Clearco switched to Grafana IRM, including a “killer feature” that can route alerts based on Kubernetes labels.
2. Easy migration to Grafana IRM
Video and visual communications software company Prezi began using Grafana Cloud for log management, but the company’s SRE team quickly realized there was another valuable use case — incident response and management. More specifically, they were able to replace their previous escalation tool, PagerDuty, because Grafana IRM provided similar functionality while at the same time saving “tens of thousands of dollars per year,” according to Alexander Koehler, a senior SRE at Prezi.

Prezi had 133 services reporting to PagerDuty, and it was used by 94 individuals on 27 different teams, with each team using its own escalation policy. Despite that complexity, the transition to Grafana IRM went smoothly, with Grafana Labs engineers chipping in to ensure a seamless migration.
And on top of the lower costs and feature parity, Prezi’s SREs now use Grafana Alerting, Grafana OnCall, and Grafana Incident and find it easier to navigate incidents in Grafana Cloud.
“We also saw that with the integration in the Grafana UI, the workflow is seamless and does not require multiple context switches when dealing with issues,” Koehler said.
Learn more about Prezi’s cost-saving shift to Grafana IRM, including some tips on how to navigate the transition to Grafana Cloud.
3. Correlate signals for faster MTTR
Ultimate, a customer support automation provider, was already using Grafana OSS when they opted to move to Grafana Cloud to consolidate their observability strategy. They wanted one IRM suite to navigate dashboards and see metrics and logs side-by-side, and as a result they’ve saved money and improved workflows and communication for on-call teams.
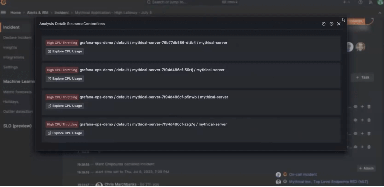
“Part of the appeal of Grafana Cloud was the idea that we can have all of those things in one suite, so it will be very easy for developers to navigate,” says Shashi Ravula, Platform Engineering Manager at Ultimate. As a result, “I noticed that when I’m on call and I get the alert, I’m way more assured about whether it’s us or a third-party provider we integrate with, because we have the logs, we have the metrics now, and people started to build a lot of dashboards,” adds Alexander Rösel, a senior software engineer at Ultimate.
Since shifting from their previous setup to Grafana Cloud, they’ve increased the number of active users (from 15 to 50), dashboards (from 20 to 70), and log volumes (from 7.8 GB to 28 GB). They’ve also increased the number of data sources in Grafana from one to 22.

“We want to see where we can be more efficient with capacity planning or performance bottlenecks and troubleshooting and root cause analysis, which would even impact our MTTR and all of these other DevOps numbers,” Ravula said.
And that’s possible because Ultimate now has a consistent way of handling incidents with Grafana IRM. On-call teams are no longer running around updating everyone on the process. Instead, they’ve automated the process of declaring, assigning tasks, and communicating incidents, which has made a huge impact in their ability to respond to incidents in a timely manner.
Find out more about how Ultimate leverages Grafana IRM, including how Grafana Cloud became part of a larger cultural shift for their engineers.
Grafana Cloud is the easiest way to get started with metrics, logs, traces, and dashboards. We have a generous forever-free tier and plans for every use case. Sign up for free now!


