How to set up home automation: A beginner's guide with Grafana Cloud and Home Assistant
I first learned about Home Assistant when my previous job’s manager shared that he charms his wife by using home automation to have Alexa announce the weather as she starts getting ready for the day. After that, he showed us the cool Grafana dashboards where he visualizes his entire home automation setup on a screen in his basement.
As fate would have it, I got a chance to work for Grafana Labs soon after that, and I started building my own home automation setup using Grafana Cloud. (If you don’t have an account yet, you can sign up for free here.) Using the tech I already owned, I went from zero to mid-level proficiency in home automation with corresponding Grafana dashboards.
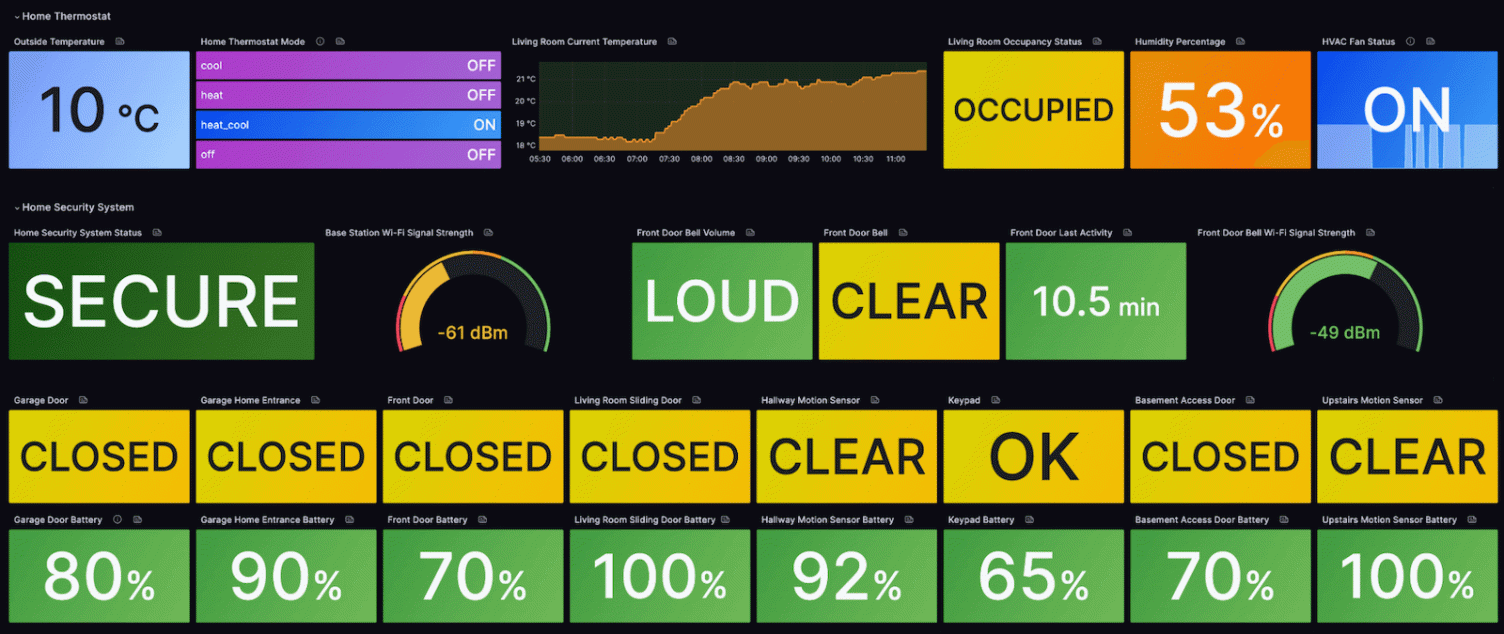
I turned everything I learned from that experience into a presentation at GrafanaCon 2023. This post will provide a step-by-step guide for the concepts covered in that session, so you’ll be able to visualize and monitor your home with a few smart devices. You could even end up with a dashboard like this:

Getting started with home automation
Here’s a list of the hardware you need before you begin:
- Raspberry Pi 3 or Raspberry Pi 4
- Wi-Fi router
- Some smart devices — I will be using smart plugs (Wemo/Belkin), smart switches (Meross), a thermostat (Ecobee), a security system (Ring), an HP printer, and a MacBook
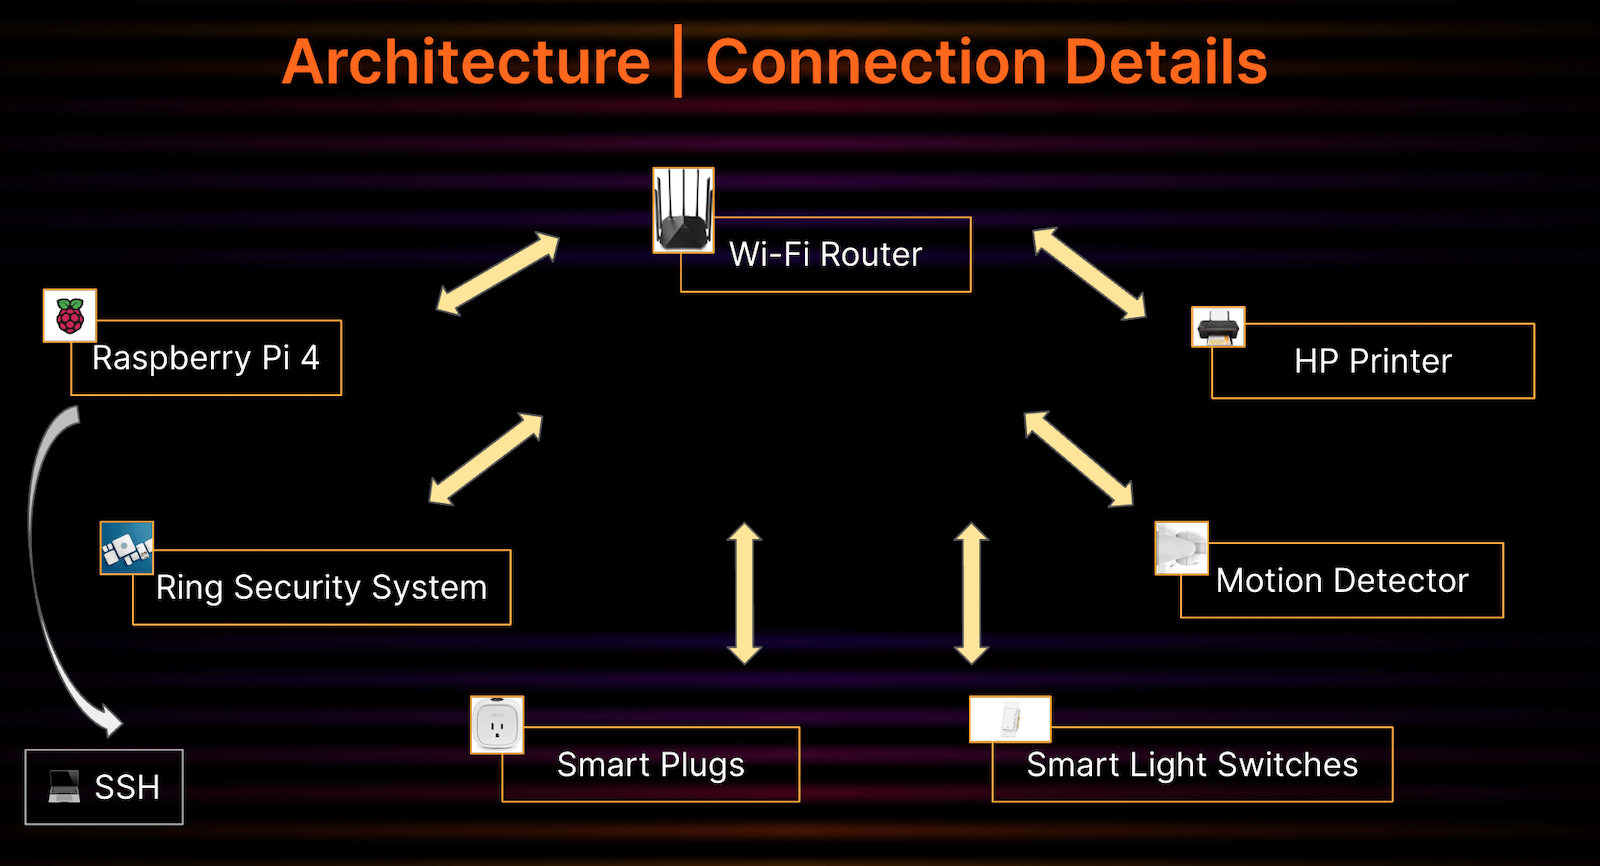
I’m stating the obvious here, but architecturally, all your smart devices, including the Raspberry Pi, need to be connected to your Wi-Fi router at home. Essentially, the Raspberry Pi should be able to communicate with all your smart home devices. (You can even have the Raspberry Pi connected to the router’s Ethernet port if that works better.) Here’s a peek at my home setup:
Set up Home Assistant, MQTT, Prometheus, and Grafana Cloud for home automation
In this section, I’m going to dive into the setup and configuration details. Follow the step-by-step list below.
Home Assistant
I’ll be using Home Assistant as the primary home automation software in this project. It is a free and open-source software for home automation, designed to be a central control system for smart home devices with a focus on local control and privacy.
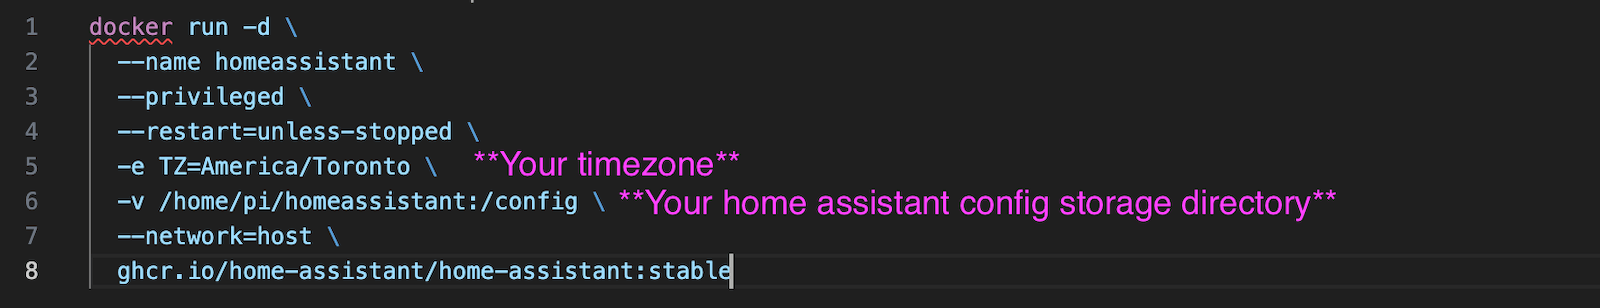
The company recommends several different installation method — I will be using the “Install Home Assistant Container” option for Raspberry Pi. This is the docker run command I used: which you can copy and fill in with your own time zone and storage directory.
docker run -d \
--name homeassistant \
--privileged \
--restart=unless-stopped \
-e TZ=America/Toronto \
-v /home/pi/homeassistant:/config \
--network=host \
ghcr.io/home-assistant/home-assistant:stable
If you want to copy and paste the code above, here’s where you’ll want to fill in your own time zone and storage directory:
You can quickly verify the installation by looking for containers that are currently running.

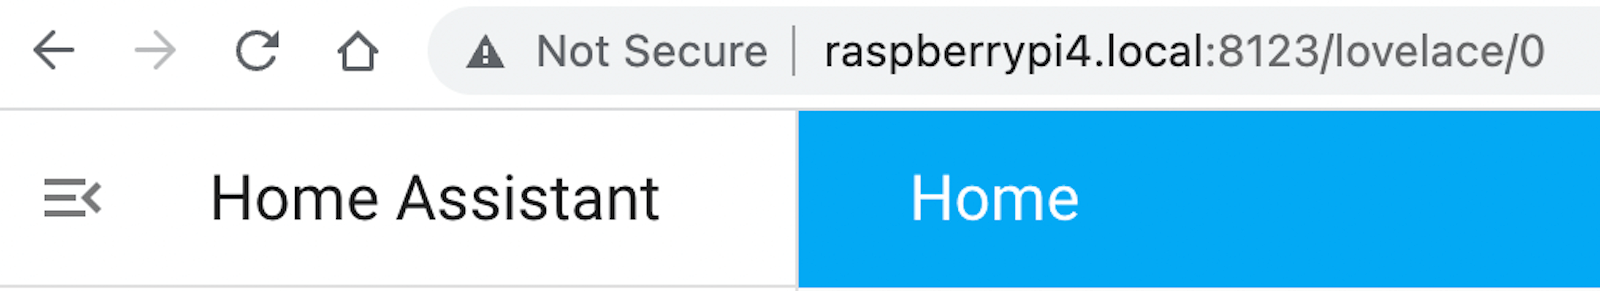
If they are running successfully, you can open up the Home Assistant home page by navigating to your Raspberry Pi’s IP address/URL followed by the Home Assistant’s port number (8123).
As soon as Home Assistant is up and running, it will automatically start discovering and identifying some of your smart devices (and not-so-smart devices 🙂) on the network. Mine automatically found my home router and my Samsung TV.

To add smart home devices manually, follow the process documented here.
MQTT
This was one of the more important integrations to get up and running for my home lab, and I needed it to get the data out of my Ring home security system.
If you search for MQTT integrations on the Home Assistant website, several of them show up. I used the standard one. One of the prerequisites for this step is to have an MQTT broker running in your home network. I learned in this guide that there are three potential installation options for the MQTT broker:
- Home Assistant Add-on Install (for users running Home Assistant OS or Home Assistant Supervised)
- Docker Install (fully supported and highly preferred)
- Manual Install (possible, but largely self-supported)
I chose Docker Install and followed these steps to get it up and running:
- Pull the docker image on your Raspberry Pi using
docker pull tsightler/ring-mqtt - Run the initial setup command. This helps set up authentication with your Ring account. Download the necessary API keys for future communication.
- This is the generic command: docker run -it –rm –mount type=bind,source=<host_path>,target=/data –entrypoint /app/ring-mqtt/init-ring-mqtt.js tsightler/ring-mqtt
- This is the specific command I used:
docker run -it --rm --mount type=bind,source=/home/pi/ha-ring-mqtt,target=/data --entrypoint /app/ring-mqtt/init-ring-mqtt.js tsightler/ring-mqtt
- Now that your account has been authenticated and linked, run the MQTT broker using this command:
- Generic command: docker run -it –rm –mount type=bind,source=<host_path>,target=/data –entrypoint /app/ring-mqtt/init-ring-mqtt.js tsightler/ring-mqtt
- Specific command I used:
docker run -d --name ring-mqtt --restart unless-stopped --mount type=bind,source=/home/pi/ha-ring-mqtt,target=/data tsightler/ring-mqtt
One important configuration change for MQTT was to edit the “mqtt_url” field in config.json (found in the host_path) from localhost to the IP address of the Raspberry Pi hosting the MQTT — this is because we are running it in Docker. This change establishes connectivity between the IoT devices and the MQTT broker trying to publish messages. See the snapshot below.
![A screenshot showing the edited mqtt_url field in config.json, with an arrow pointing out the IP address of the Raspberry Pi hosting the broker.]()
Once you’re done, you should see most of your IoT devices show up in the Integrations (check the 12 devices and 60 entities listed in the MQTT tiles below) and the Overview HomeAssistant dashboard. Mine looked like this:
![A screenshot of IoT devices in the Integrations and the Overview HomeAssistant dashboard.]()
Prometheus
In case you do not have a Prometheus server already installed on your Raspberry Pi, follow the steps below to quickly install one:
![A screenshot of steps explaining how to install a local Prometheus server on a Raspberry Pi.]()
And here’s the code, if you want to use it for your own home:
# Search for Prometheus packages
sudo apt-cache search Prometheus

# Install Prometheus
sudo apt-get install prometheus

# Verify Prometheus installation
sudo systemctl status prometheus

# Start Prometheus automatically on reboot
sudo systemctl enable prometheus
Once installed, it’s important to direct the Home Assistant server to create Prometheus metrics for the data it has access to via integrations. (See this Home Assistant Prometheus integration docs page for more details.) I made the change in my Home Assistant configuration by editing the file in my /home/pi/homeassistant, which is synced to the /config directory in the Home Assistant container. Here’s how to do that:
![A screenshot of the steps required to install the Home Assistant Prometheus integration, pointing out the Prometheus configuration block.]()
After that, configure your Prometheus server to scrape the Home Assistant metrics like this:
![A screenshot showing how to configure a Prometheus server to scrape the Home Assistant metrics.]()
Grafana Cloud
You can use Grafana Cloud to store Home Assistant metrics and then dashboard/alert off of those metrics. Here is how to push them to Grafana Cloud for long-term storage and analysis:
![A screenshot showing the configuration for pushing the Home Automation metrics to Grafana Cloud.]()
Dashboarding and alerting with Home Assistant data
Once again, here is my Grafana dashboard, which I created using data coming from Home Assistant. I can look at this and quickly see the living room temperature, humidity levels, occupancy and HVAC fan status, and various stats for my home security system. (You can find the JSON for the dashboard here.)
![A screenshot of a Grafana dashboard showing temperature, humidity levels, occupancy and HVAC fan status, and stats for a home security system.]()
Alerting
Grafana Alerting allows you to learn about problems in your systems moments after they occur. For example, I want to be alerted when one of my Ring home security sensors has a very low battery percentage (< 20%) so I can replace the batteries before they die. Creating a Grafana alert is very simple. Just follow these steps:
Click on Alerts & IRM under the hamburger Home menu. Then, click on Contact points.
![A screenshot of the Contact points settings for Grafana Alerts & IRM.]()
Create an alert rule, then navigate to the Alert rules section and click on the blue New alert rule button.
![A screenshot of the Alert rules page in the Alerts & IRM settings.]()
Add some annotations and labels to the alert.
![A screenshot of a settings page for adding annotations and configuring notifications.]()
Finally, tie the alert rule with the corresponding action by setting up the notification policy.
![A screenshot of the setting page for adding notification policies.]()
Now you’re all set!
The big payoff
I’ve found the combination of Home Assistant and Grafana Alerting to be really beneficial — especially when I was about to head out for a long overdue (thanks to Covid! 😏) three-week European vacation.
Our front door and basement entrance sensor were low on batteries, and unlike my previous manager, I didn’t have a dedicated screen monitoring my setup. But thanks to Grafana Alerting, I got a timely notification and replaced the batteries before we headed off on our trip. This gave us the much needed peace of mind that our house is going to be safe while we are away.
Hopefully this step-by-step guide will help you get started on your own home automation journey.
Good luck!
Grafana Cloud is the easiest way to get started with metrics, logs, traces, dashboards, and more. We have a generous forever-free tier and plans for every use case. Sign up for free now!