Monitor Amazon EC2: key metrics for instances, regions, and more in one view
Amazon EC2 was one of the first services available on AWS, helping propel the cloud platform into the mainstream of IT. And while EC2 instances come in a wide range of sizes and flavors to address all sorts of use cases, keeping tabs on those instances isn’t always easy.
That’s why we’re excited to introduce our new EC2 monitoring solution in Grafana Cloud. With our latest AWS integration, you can start observing your EC2 instances faster and easier, without the need to manage and configure local agents.
In this blog, we’ll show you the benefits of this new solution, which provides an in-app experience similar to what we’ve built with our popular Kubernetes Monitoring app. We’ll also show you how to get started in a few quick steps, so you can begin monitoring your AWS compute instances in Grafana Cloud today.
Why you should use the new EC2 monitoring solution
This new EC2-focused solution, which was built using Grafana Scenes, provides a more opinionated experience that helps you:
- Focus on priority metrics for different use cases (and block out the noise of metrics that don’t matter as much for your goals)
- View dozens to thousands of instances in a more digestible manner
- Pare down the list of instances to the ones you care about, by filtering by AWS account ID, region, scrape job, or tag
- Sort instances by metrics based on industry best practice thresholds
- Quickly and efficiently spot the specific instances that require more attention
- Drill down into the instance detail view to figure out what’s going on and why
Let’s take a quick look at some of the functionality to see how it makes it easier than ever to keep tabs on EC2.
View all your instances, across accounts and regions
The Overview tab gives you a bird’s eye view of all your instances across all of your accounts and regions, which is helpful for governance.
You can also filter views to narrow the focus to just the instances that you and your team care about, based on how you’re using AWS tags. For example, if you’re using tags to associate instances with the services being hosted, you can narrow your view to contain only instances for the services that your team owns.
This view is also helpful for identifying looming issues before they become incidents. For example, it can bubble up instances with higher CPU than normal, or instances that are about to burst or hit I/O limits.
In the screenshots below you’ll see just some of the ways you can sort and customize your views in the Overview tab.


Drill down into instance details
Say you noticed an instance in the Overview tab with an unusually high CPU. You can drill down to get a comprehensive view of all available metrics for this instance, which may help you diagnose the problem. The instance detail also provides metadata you might need in order to access the instance, as well as smart linkages between your instance and the AWS console.

Monitor scaling based on regions and tags
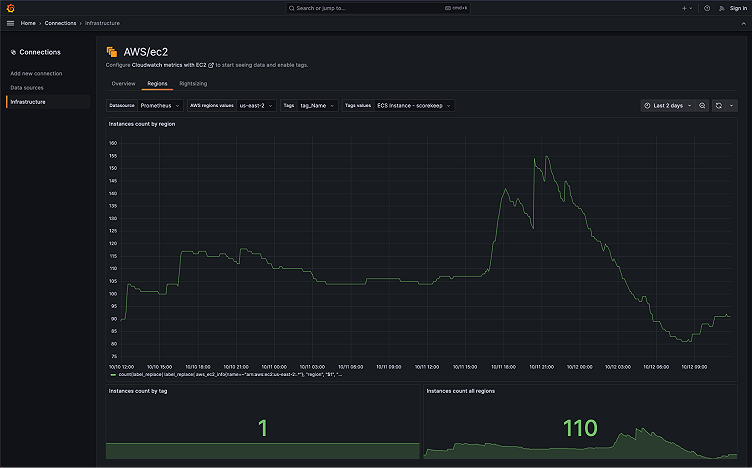
With the regions tab, you get an overview of how your instances scale over a region or based on a tag.

Optimize resources and reduce costs
This view is designed for those responsible for resource optimization and identifying opportunities to reduce costs. Lists of top or bottom instances per metric help you to see where you could allocate more or less resources or repack instances.

How to access the experience
To start monitoring your EC2 instances, you need to configure the AWS integration.
To do that, follow these steps:
- Log in to your Grafana Cloud account. If you don’t have one, you can sign up for a forever-free account today.
- Navigate to the Connections page, then click on Add new connection
- Search for “AWS” and click on the AWS card
- Select the CloudWatch metrics option
- Choose whether to automatically or manually configure the IAM authorization role for the connection to AWS. The automatic method gives you the option to use AWS CloudFormation or Terraform to create the role. If you opt for the manual route, you have to create the role yourself. Once the role is created, enter its Amazon Resource Name (ARN) into the connection setup and check the box to include tags (Include your AWS resource tags).
- Select the EC2 service.
- Click on the Create scrape job button.
- Install the out-of-the-box Grafana dashboards.
- Click Explore EC2 data at the bottom of the page to see the available dashboards for EC2.

Alternatively, it’s possible to access this view by clicking on the View EC2 data button above the list of scrape jobs, if EC2 was configured.

Start monitoring your EC2 instances today with Grafana Cloud
The new EC2 solution is available now for Grafana Cloud, so try it out today! And let us know what you think; reach out in our Grafana Labs Community Slack in the #Integrations channel to share your thoughts.
And if you’re looking to monitor other environments, check out our solutions page for a list of other tools and platforms we can help you visualize and monitor with Grafana Cloud, including more ways to monitor dozens of AWS offerings. At Grafana Labs, we have a “big tent” philosophy of providing a consistent experience across as many data sources and environments as possible, and we’re continuing to expand our solutions to support our community’s needs.
Grafana Cloud is the easiest way to get started with metrics, logs, traces, dashboards, and more. We have a generous forever-free tier and plans for every use case. Sign up for free now!


