How to create alerts to monitor sensor data with Grafana, Prometheus, and Telegram
When monitoring sensor data, such as data from a weather station, a home security system, or a home automation assistant, it’s useful to have an alerting system in place, as well. By setting up alerts for sensor data, you can automatically receive notifications when any significant event occurs — whether that’s someone arriving at your front door or a thunderstorm rolling in.
It’s also possible to receive these alerts through various communication channels, such as email, SMS, or a messaging app like Telegram.
In this blog post, we will demonstrate this process. Specifically, we will walk through how to use Grafana Alerting to send notifications related to temperature and humidity levels to the Telegram app.
Note: This post builds off of a previous tutorial in which we install a temperature and humidity sensor, create a Python app to export the sensor data, run Prometheus to collect and store it, and then visualize the data in Grafana. If you are already familiar with pulling sensor data with Prometheus and Grafana, and you are only interested in building an alert for it, continue reading on! Otherwise, it might be helpful to pause, reference that previous tutorial, and then revisit this one.
Types of alert rules in Grafana Alerting
Before we get started, it’s important to note that Grafana Alerting supports two alert rule types: Grafana-managed alert rules, which allow you to create alerts that can act on data from multiple data sources, and data source-managed alert rules, which are alert rules created and stored within the data source itself. In our case, our data source is Prometheus, so we will be creating a Grafana-managed alert rule. This is because Grafana uses Prometheus Alertmanager as the default Alertmanager, which handles alerts sent by client applications, such as the Prometheus server.
With Grafana-managed alert rules, you query the data source, transform the returned data, and then set a condition under which the alert should trigger. As a result, you will receive notifications when the alert triggers or resolves. If you link the alert to a visualization, such as the time series panel, you will also be able to observe the alerted event in the form of an annotation.
In addition to creating an alert rule, we need to create a contact point to send the notifications to, as well as a notification policy that defines which contact point receives the notification when we have multiple receivers.
Now that we’ve reviewed some of these key concepts related to Grafana Alerting, let’s create an alert to query our database and create an alert for the sensor data.
Alert configurations: a real-world example
To illustrate how alert configurations work, let’s look at a real-life situation in which it would be useful to have alerts for temperature and humidity sensors.
Let’s say we want to receive an alert if the temperature and humidity in a room — perhaps the room where a baby or a child sleeps — is greater or less than a certain level. With Grafana, we can not only visualize in a graph when, how long, and how often the temperature and humidity levels are above or below a particular point, but also be notified whenever the alert gets triggered. This notification would allow us to take certain measures, such as turning up the heat or turning on a humidifier, to ensure the room is comfortable.
Metrics can be queried and measured separately with Prometheus. And, since we want to trigger alerts when the data is outside of different ranges for temperature and humidity, we should create separate alerts for each metric and range.
In addition to querying our data with Prometheus, we will also use expressions. Expressions are used to perform calculations, transformations, or aggregations on the queried data. So, we can select the last value returned by the Prometheus query, and create a condition to check if the metric is outside of the range we want to monitor.
Note: You could use Prometheus’ instant vector and built-in functions instead of expressions. This approach is recommended whenever possible for performance reasons. However, for the sake of simplicity and learning about Grafana-managed alerting features, we will use expressions in this tutorial.
Create the alert rule
Below are the steps to create each alert rule. We will start with the alert rule for temperature, and then cover the alert rule for humidity.
Alert to monitor temperature
In Grafana, toggle the menu at the top left side of the screen, and navigate to Alerting > Alert rules. Click on + New alert rule.
Enter alert rule name
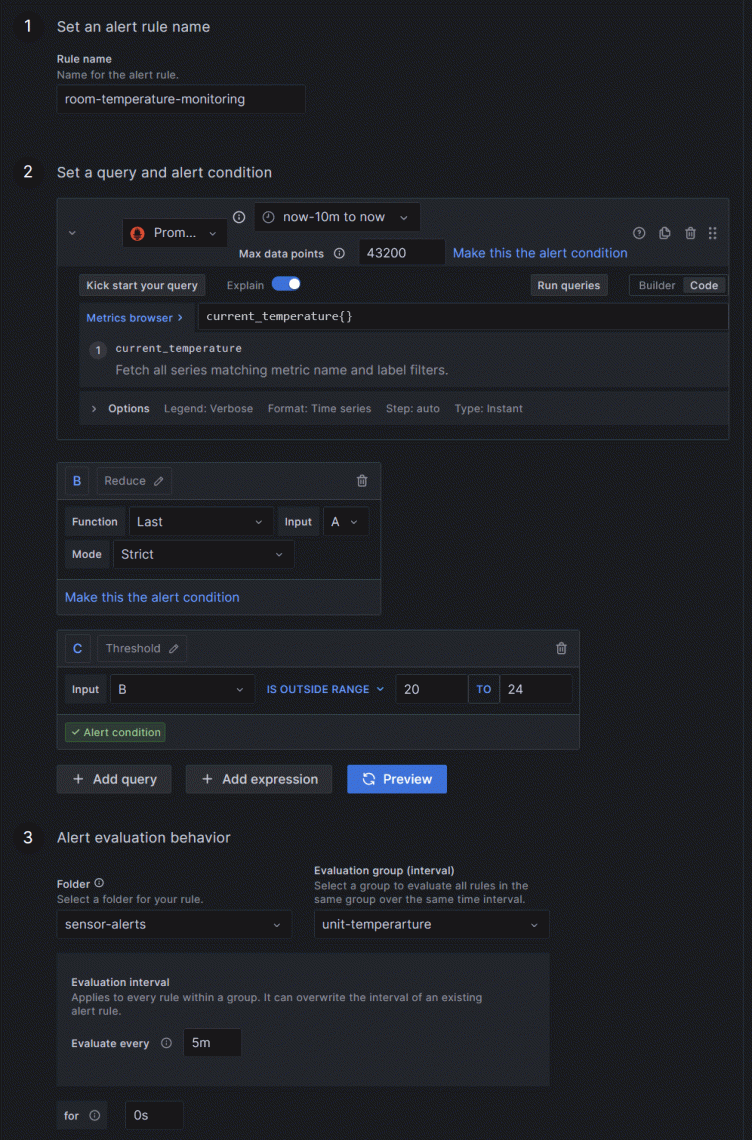
- Give a name to the alert rule. For instance, room-temperature-monitoring.
Define query and alert condition
- Choose the data source from the drop-down menu. Since our data source is Prometheus, the rule type should automatically switch to Grafana-managed alert. Note: prior to this point, you should already have added Prometheus to your Connections.
- In the Metrics browser field, select the matched label (key-value pair associated with time-series metrics captured by the temperature and humidity sensor). In our case, we select
current_temperature. - Keep the expression “B” (Reduce) as is. The Reduce expression comes by default when creating a new rule. It selects the last value of the query (“A”), which is exactly what we need.
- In expression “C” (Threshold), select IS OUTSIDE RANGE in the drop-down. Here we will set a range of values that we want to exclude from the alert evaluation (values from 20 to 24). This means the alert will only trigger if the temperature is less than 20C or greater than 24C. This is our alert condition and it comes marked as such by default. The Threshold expression will check if the last value from expression B is within or outside the range. It returns 0 when the condition is false and 1 if the condition is true.
- Click Preview.
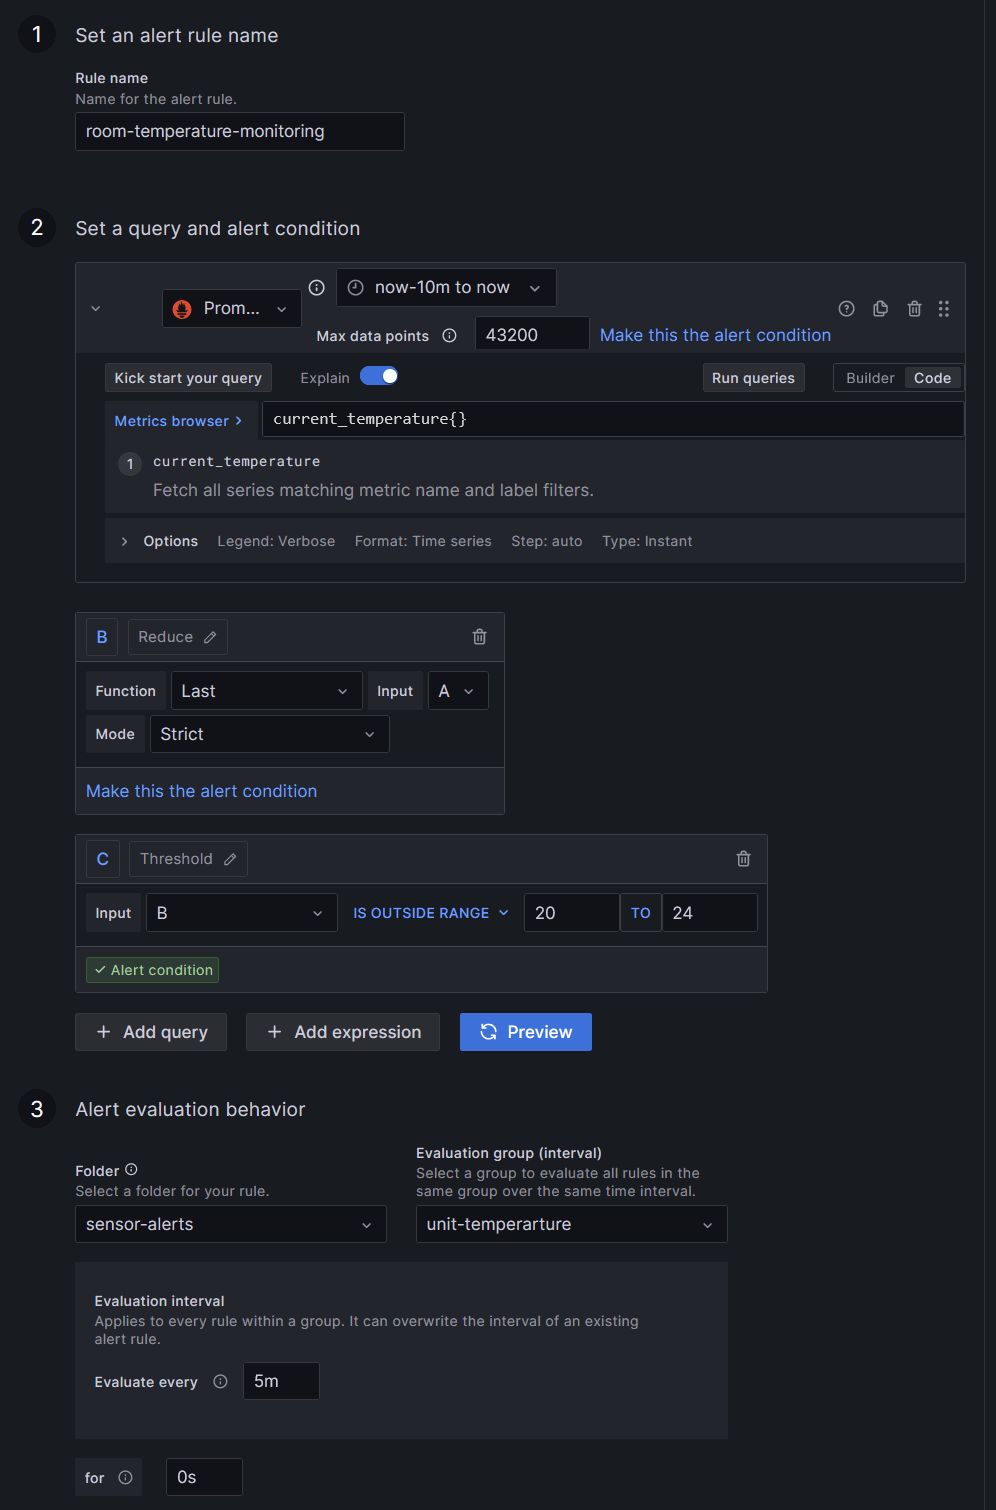
At this point, our alert should be working (it should be either in Firing or Normal state). If it returns an error, follow the instructions in the error message. If it returns “No data,” reselect the metrics from the Metrics browser; make sure the Input of each expression is correct (expression B: Input A and expression C: Input B). If you still get stuck, you are very welcome to post questions in our Grafana Community forum.
Let’s fill in some other important details.
Set evaluation behavior
- In Folder, click + New folder and enter a name. For example: sensor-alerts. This folder will contain our alerts.
- In the Evaluation group, repeat the above step to create a new evaluation group. We will name it room-sensor-group.
- Choose an Evaluation interval (how often the alert will be evaluated). For example, every
5m(5 minutes). - Set the pending period (aka, the “for” period). This is the time that a condition has to be met until the alert enters into a Firing state and a notification is sent. For example,
5m(5 minutes), or0sif you want it to fire the moment the condition is met.
Add annotations
In this section, we can include data from queries and expressions into annotations, which are used for adding additional info to an alert. An annotation can combine plain text and template code that is evaluated when an alert is fired. This is where we can add a short summary of what happened and why. We achieve this by using templates, which are written in Go’s templating language.
Here’s an example of a summary using labels and values to interpolate the actual details of our alert:
the temperature in the room is {{ index $values "B" }}In addition, you can select the Link dashboard and panel button to link the alert to an existing panel where you are measuring your sensor data. As mentioned earlier, linking an alert to a panel will add an annotation to the panel when the status of your alert changes. If you don’t have a panel already, and since this is optional, you can skip this step for now and link it after you have finished configuring the alert.
Configure notifications
If you wish to route notifications of this alert to a specific contact point, you should add a label so the alert is matched with a notification policy (more on that in the contact points section below). For example, you could add device as the label and room-sensor as the value (so it looks like: device = room-sensor).
That’s it for our first alert.
Alert to monitor humidity
For our second alert, you basically repeat the steps above, except for the following differences:
Enter alert rule name
- For this alert, let’s use the name room-humidity-monitoring.
Define query and alert condition
- In the Metrics browser field, select the matched label. In our case, we select
current_humidity. - In expression “C” (Threshold), select IS OUTSIDE RANGE in the drop-down. Here we will set a range of values that we want to exclude from the alert evaluation (values from 40 to 65). This means the alert will only trigger if the humidity is less than 40% or greater than 65%.
Set evaluation behavior
- In Folder, choose sensor-alerts from the drop-down menu. This folder contains our alerts.
- In the Evaluation group, choose room-sensor-group. Note that the Evaluation interval is already set since we defined it when we created the Evaluation group for our first alert.
- Set the pending period. For example,
5m(5 minutes) or0sif you want it to fire the moment the condition is met.
Add annotations
Here’s an example of a summary using labels and values to interpolate the actual details of our alert:
the humidity in the room is {{ index $values "B" }}Configure notifications
Again, if you wish to route notifications of this alert to a specific contact point, you should add a label so the alert is matched with a notification policy. For example, you could use device = room-sensor.
Now that we have finished creating both alerts, we will add a new contact point and configure our notification policy, so the alerts are routed to the new contact point.
Add a contact point
Let’s define where our notifications are sent. For this example, we will add Telegram as a contact point:
- Follow the steps in this guide to get your Telegram bot API token and chat ID.
- Click + Add contact point.
- From Integration, select Telegram.
- Enter your Telegram credentials (aka, the bot API token and chat ID you got in step 1).
- Click Test to check that the integration works.
- Click Save contact point.
You should receive a test notification.
Now that we’ve made the connection to Telegram, we will set up this contact point in our notification policy.
Set up the notification policy
This is the final step of this guide. You are almost done!
We are going to add a new nested policy. In our case, it is more convenient to create a new policy than edit the default notification policy, because we only want to send notifications related to the alert that we just created to our contact point (Telegram). We do that by linking the labels of the alert to the labels of the new notification policy we are about to create:
- Under Default policy, click + New nested policy.
- Enter the same label and value that we entered in our alert (
device = room-sensor). - In Contact point, select
telegram. - Click Save policy.
Note: When the alert triggers, by default, it will take 5 minutes to receive a new status update (only if the status has changed from “Firing” to “Normal"). You can override this setting in our notification policy, if you want to receive notifications of status changes more or less frequently. Once the condition is no longer breached for the pending period you chose, the alert will be “Resolved,” and you will also be notified.
Receiving an alert
Once the alert rule condition is met, you should receive an alert.
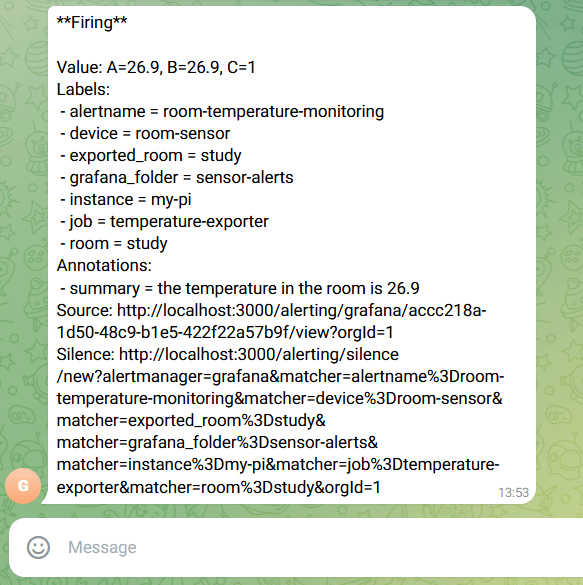
The alert comes with additional information besides the annotation summary we wrote, such as links to perform actions like silencing your alert or visiting the panel to which the alert is linked.
Once the alert is “Resolved,” a notification is sent with the update.
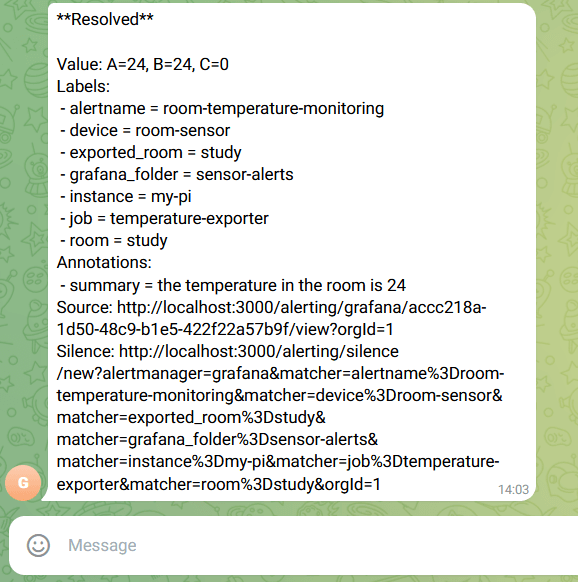
That’s it! Kudos on successfully creating and configuring your alert.
More Grafana Alerting resources
To learn more about Grafana Alerting, you can check out our recent blog posts, as well as our technical documentation.
Grafana Alerting is available for Grafana OSS, Grafana Enterprise, or Grafana Cloud. The easiest way to get started is with Grafana Cloud’s generous forever-free tier. Sign up for free now!

