A comparison of InfluxQL, SQL, and Flux query languages for Grafana dashboards
Grant Pinkos manages two businesses near Detroit, Michigan. He enjoys Industrial IoT, Industry 4.0, guitar solos, and Pomeranians, and holds a BS in engineering and an MBA. Grant is a Grafana Champion and is very active in community discussions. He has also presented at GrafanaCON and authored a tutorial.
InfluxDB is an open source database optimized for fast, high-availability storage and retrieval of time series data, such as physical sensor data, network and server metrics, and financial and trade data. Grafana is the go-to visualization tool for InfluxDB, turning that raw data into eye-catching charts and dashboards that provide valuable insight into that data, and make data analysis and alerting a breeze.
Together, InfluxDB and Grafana are a powerful duo for data management and visualization — and can bring your observability game to the next level.
Before getting started, however, Grafana users who store data in InfluxDB need to choose from three possible query languages:
- InfluxQL: This is an SQL-like query language for interacting with InfluxDB. It’s intended to feel familiar to those coming from other SQL or SQL-like environments, while also providing specific features for storing and analyzing time series data.
- SQL: With the release of InfluxDB 3.0, InfluxData (the company behind InfluxDB) introduced a new Grafana plugin called FlightSQL. This plugin allows you to query and visualize data using SQL by enabling queries to FlightSQL APIs. In the future, Grafana will offer native support for SQL-based queries of InfluxDB, allowing easy connection to an InfluxDB 3.0 system and streamlining the query-editing process.
- Flux: This is an open source functional data scripting language designed for querying, analyzing, and acting on data. Flux has almost 400 functions available in the standard library that retrieve, transform, process, and output data.
In this blog post, we’ll walk through the top considerations for choosing between these three query languages, and then explore some sample Grafana dashboards created using these languages.
Compare InfluxQL vs. SQL vs. Flux
The right query language for you depends on the version of InfluxDB OSS or InfluxDB Cloud you are running, your comfort level with SQL, and the complexity of your requirements.
The following table summarizes the key pros and cons of InfluxQL, SQL, and FLux for Grafana and InfluxDB users, as of December 2023.
| InfluxQL | SQL | Flux | ||
|---|---|---|---|---|
| Pros | Powerful language that can be used to perform a wide range of queries on time series data, including selecting and filtering data; aggregating data; and performing mathematical operations on data. Relatively easy to learn, especially for those who are already familiar with SQL. | Provides powerful tools for analyzing and summarizing data. Aggregate functions, GROUP BY, and HAVING clauses allow users to perform complex analyses and generate meaningful reports from large datasets. Widely adopted and supported by various relational database management systems, allowing users to apply SQL skills across different database systems. Has a relatively simple and straightforward syntax, making it accessible to both beginners and experienced developers. | Includes a number of features that are not available in InfluxQL, including support for user-defined functions to perform custom data transformations or complex calculations. Also has more powerful aggregation capabilities than InfluxQL, such as support for windowing and rolling aggregations. Supports querying and joining data from multiple data sources, including other time series databases and relational databases. | |
| Cons | Lacks the hundreds of customizable functions that Flux or SQL offers, but renewed attention by InfluxData should position InfluxQL well going forward. | Use of the new Grafana plugin called FlightSQL does not support template variables. | Learning curve can be steep. Put into “maintenance mode” in 2023 by InfluxData, but being continued via FluxPipe. | |
| Compatibility with InfluxDB versions | All Cloud and OSS versions | 3.0 Cloud (support for OSS version said to be coming soon) | 2.0-2.7 OSS or Cloud (no longer available to new subscribers) |
Grafana dashboards for InfluxDB
Regardless of which query language you choose, you can create captivating and functional dashboards in Grafana using InfluxDB as a data source.
There are several sets of InfluxDB dashboards on play.grafana.org that illustrate how you can achieve the same results with the different query languages outlined above. These interactive examples demonstrate:
- A variety of visualizations, including time series, bar charts, pie charts, stat panels, and tables.
- Popular functions, including aggregating by day/week/month and creating a list that displays the top events and the date they occurred.
- Use of template variables that dynamically change the panel(s) based on the value(s) selected.
- Grafana transformations to organize the data received from the query and make it more intuitive.
These dashboards use electricity data for the U.S. Lower 48 States, published every hour by eia.gov. This includes hourly electricity demand, generation, and interchange data for 13 separate geographic regions, with the generation data being categorized even further into 8 different fuel types, such as solar, wind, or hydro.
The hourly data values contain the tag name type to describe whether the value is for demand, net generation, or total interchange, while the tag name region describes which region these values correspond to. For example, as shown below, on 08/23/2023 at 19:00, there were 3 values being ingested for each of the 13 regions — or 39 readings ingested every hour.
| Time | Value | Measurement | Region | Type | ||
|---|---|---|---|---|---|---|
| 1 | 2023-08-23T19:00:00Z | 35921 | ElectricPowerOperations | California | Demand | |
| 2 | 2023-08-23T19:00:00Z | 32005 | ElectricPowerOperations | California | Net generation | |
| 3 | 2023-08-23T19:00:00Z | -1824 | ElectricPowerOperations | California | Total interchange | |
| 4 | 2023-08-23T19:00:00Z | 35607 | ElectricPowerOperations | Carolinas | Demand | |
| 5 | 2023-08-23T19:00:00Z | 35789 | ElectricPowerOperations | Carolinas | Net generation | |
| 6 | 2023-08-23T19:00:00Z | 179 | ElectricPowerOperations | Carolinas | Total interchange | |
| … | … | … | … | … | … | |
| 37 | 2023-08-23T19:00:00Z | 78786 | ElectricPowerOperations | Texas | Demand | |
| 38 | 2023-08-23T19:00:00Z | 78286 | ElectricPowerOperations | Texas | Net generation | |
| 39 | 2023-08-23T19:00:00Z | -499 | ElectricPowerOperations | Texas | Total interchange |
On the dashboard “Bar Charts and Time Series using Mixed InfluxDB queries,” the electricity demand for the Florida and New York regions is presented as an hourly time series panel and as a daily aggregation (sum) bar chart using all three InfluxDB query methods. There are also bar gauge panels for Flux and SQL that present the average demand for each hour of the day (aggregating all data included in the query via the time picker).

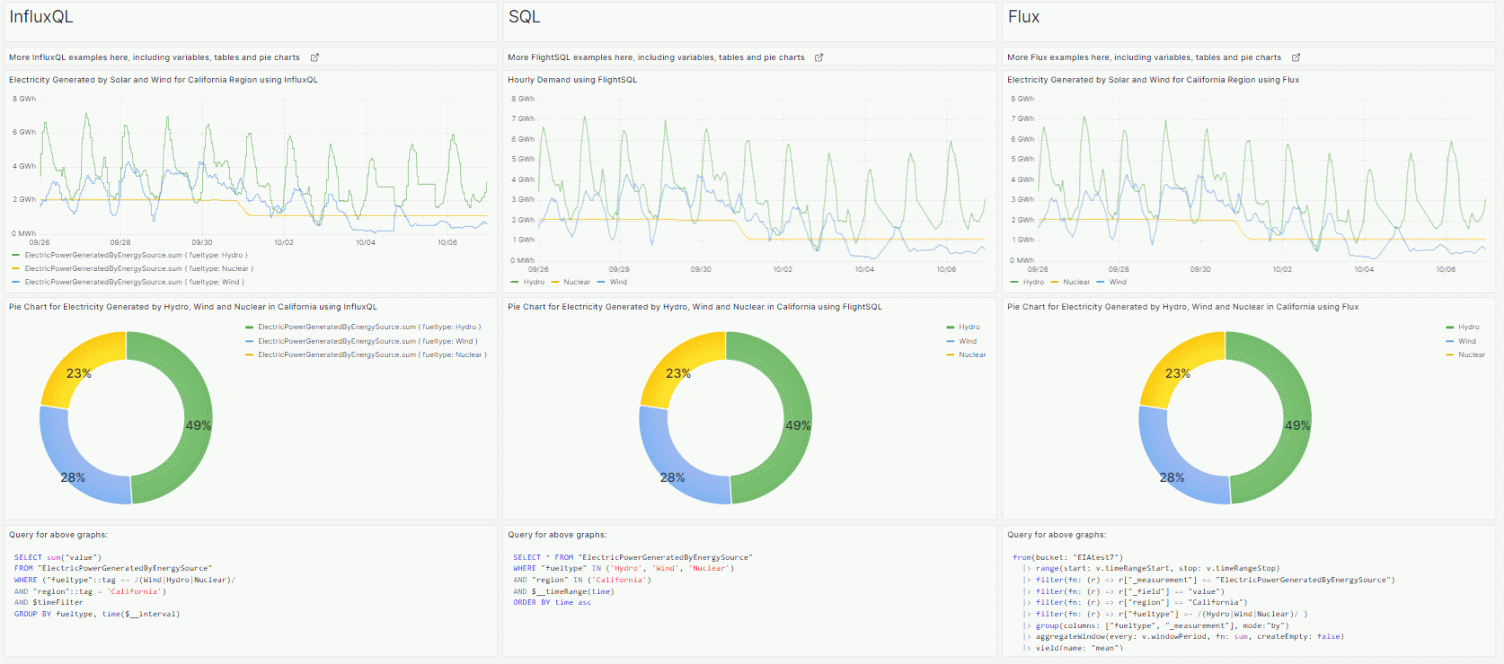
On the dashboard “Time Series and Pie Charts using Mixed InfluxDB queries,” the electricity generated by hydro, wind, and nuclear sources for the California region is presented as an hourly time series panel and as an aggregation (sum) pie chart (linked to the time window selected) using all three InfluxDB query methods:

Following the links at the top of each page are additional dashboards that deal exclusively with InfluxQL, Flux, or SQL.
As you review these dashboards, here are some aspects of each query method to take note of:
| InfluxQL | SQL | Flux | ||
|---|---|---|---|---|
| Syntax for aligning query’s time range with Grafana time picker | WHERE $timeFilter | WHERE $__timeRange(time) | > range(start: v.timeRangeStart, stop: v.timeRangeStop) | |
| Syntax for template variables (allows multiple selections) | WHERE ("region"::tag =~ /^$region$/) | WHERE "region" IN (${region}) | > filter(fn: (r) => r["region"] =~ /^${region:regex}$/ ) | |
| Helpful Grafana transformations | Series to rows needed to create certain custom tables or lists | Partition by values needed for certain time series graphs | Labels to fields needed for pie chart | |
| Aggregations for time series data | Only basic aggregations (day, week) are possible at this time | Easily aggregate, summarize, or compare data from days, weeks, months, or years by aggregating using date_Bin function | Easily aggregate, summarize, or compare data from days, weeks, months, or years, while excluding/including certain hours, days of the week, holidays, etc. |
Additional resources for using InfluxDB and Grafana
InfluxDB and Grafana are a powerful combination in the observability space — regardless of which query language you choose.
To learn more about using Grafana and InfluxDB together, you can check out Grafana Labs’ technical documentation, as well as this step-by-step guide for getting started. In addition, you can follow this tutorial to learn how to create Grafana alerts with InfluxDB and the Flux query language.
Want to share your Grafana best practices, story, or dashboards with the community? Drop us a note at stories@grafana.com.