
Grafana dashboards in 2023: Memorable use cases of the year
As the number of Grafana users grows each year, so does the variety of reasons people are using Grafana dashboards. During 2023, members of the our community — both inside and outside of the company — shared some of their incredible professional and personal projects, including how Grafana has allowed them to successfully launch a rocket, cut back on carbon emissions, and even help balance a national power grid. Let’s take a look back at some of the most unforgettable dashboards we’ve seen this year:
Award-winners
Grafana turned 10 in June, and one way we celebrated was with the launch of our first-ever Golden Grot Awards, which help highlight the amazing Grafana dashboards our community has created. But those weren’t the only dashboard-related wins this year: In March, a rocket engineering team from UCLA that uses Grafana as a visualization tool during testing and launches won the top prize in an amateur rocketry competition — and broke a world record in the process.
Monitoring energy infrastructure
The Golden Grot Awards had two grand prize winners, and in the personal dashboard category, the prize went to Nicky Sonnemans, a graduate student at Erasmus School of Economics in the Netherlands. He impressed the judges with a dashboard that monitors the current state of the European energy infrastructure — specifically current and historical information regarding gas storage, physical flow of gas throughout Europe, electricity generation, and energy prices. Sonnemans was inspired to create the dashboard because he wanted to visualize the energy data in a centralized place so he could easily spot any irregularities in real-time and receive any necessary alerts. “My main motivation,” he added, “was to showcase that Grafana can be used as a business intelligence tool and not just for technical monitoring and server monitoring.”

Solving an observability problem at work
In the professional dashboard category of this year’s Golden Grot Awards, the winner was Raymond Sowden, an IT professional in Johannesburg, South Africa. He is the CNC Team Lead at RadixTrie PTY LTD and specializes in Oracle’s JD Edwards EnterpriseOne ERP (JDE). He created his award-winning Grafana dashboard to solve a big observability problem at work: “There was no single pane of glass to monitor JDE, so our dashboard gives us unparalleled insights into the overall health and performance of JDE.” He said a big moment came when they were able to see what was happening on the backend and on the frontend: “That was when we knew we had something special.”
Raymond’s dashboard offers a high-level overview on the system health, but the various widgets link to many detailed dashboards with more technical data. It is used by his company’s JDE technicians, as well as their customers’ technicians, and all the way up to the executive level. “We have reduced the human effort of daily checks, daily reporting, and more by providing real-time insights and metrics,” he said.

Providing data visibility during a rocket launch
In a blog post about winning the Dollar Per Foot Challenge and setting the collegiate world record for highest liquid rocket altitude, university student and software engineer Philip Do explained how he and his teammates from Rocket Project at UCLA have come to rely heavily on Grafana for their work. “With our dashboards, we can quickly visualize data and monitor potential hardware issues during critical phases of testing and launch,” he said.

Projects at home
Grafana Labs firmly believes in work-life balance, but when you become so familiar with how eye-catching and informative a Grafana dashboard can be, it’s hard to resist creating one to monitor things at home. The Grafanista-made projects we featured in 2023 included one that visualizes how much a home furnace runs over time, one that monitors air quality while using a 3D printer, and one that tracks temperature and humidity in a waterfront home. There was also a project designed to monitor Plex Media Servers, which three Grafanista’s from the internal homelab Slack channel created during a hackathon.
Another notable home project came from outside of the company: GrafanaCON 2023 featured a presentation by Kyle Shelton, Senior DevOps Engineer at Toyota Racing Development, who highlighted how he took his experience with Grafana Cloud at work and used it to monitor his personal triathlon training at home with Grafana Cloud Free.
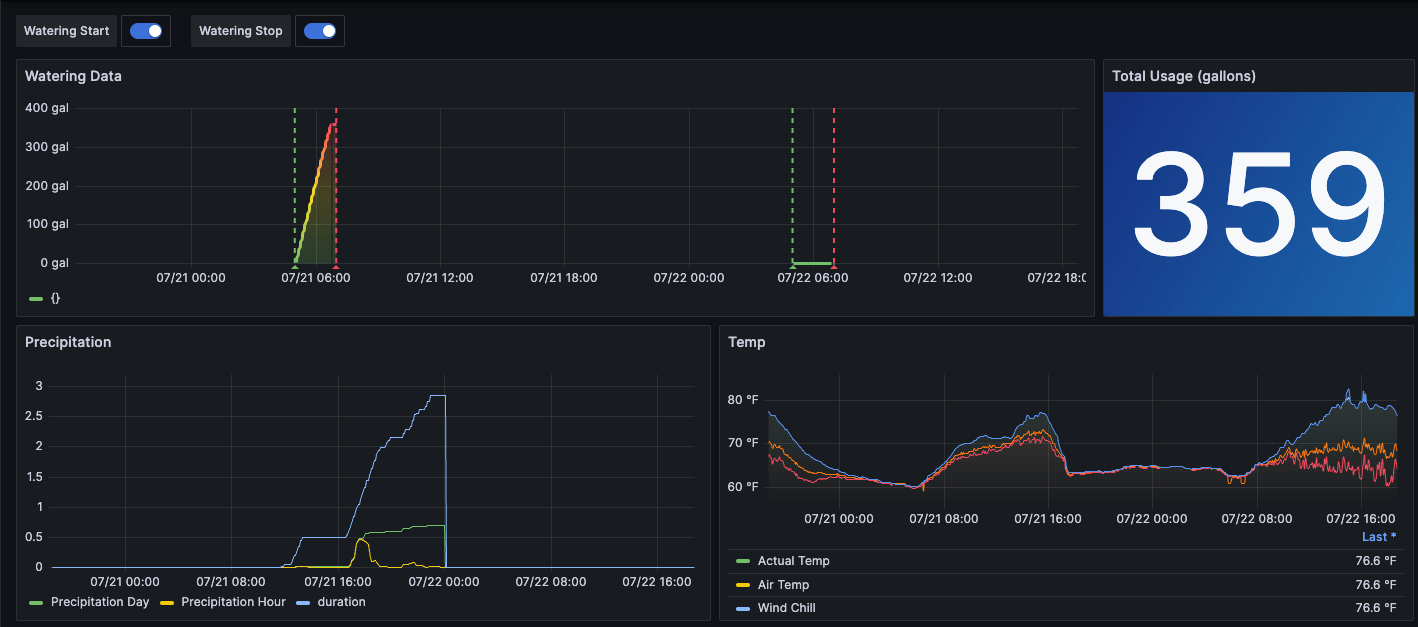
Monitoring pool water levels from anywhere
Senior Solution Engineer Brian LeBlanc built a Grafana dashboard so he could keep track of the water level in his swimming pool. It gave him the peace of mind he needed to go on a 10-day trip and not be overly stressed about potential damage to the pool pump. (Replacement cost: $1,000.) In a blog post, he explained how he set up a system with a mechanical device called a Pool Sentry, a LinkTap G2S (an IoT-enabled smart water controller he attached to a garden hose), and a Tempest weather station. He ran an exporter he found in GitHub using Docker and exported the data to Prometheus, which then wrote the metrics data remotely to Grafana Cloud Metrics, which is powered by Grafana Mimir. He explained, “The Tempest exporter pulls its data from Tempest Cloud. My local instance of Prometheus then scrapes that data and publishes it to Grafana Cloud Metrics so I can visualize it in Grafana Cloud.” As a result, he said, “I could bring together data from two IoT devices into a single pane of glass to evaluate water consumption, rainfall, and the ambient temperature.”
The project was a success in more than one way: “As a new Grafanista, it gave me some real life use cases where I was personally invested in learning our products,” he said. “It also worked flawlessly while I was on vacation with my family.”
The environment, climate, and energy consumption
Many of this year’s standout dashboards were created as part of eco-minded missions. One Grafana Labs customer turned to Grafana to help reduce its impact on the environment. In another use case, we learned how Grafana Cloud played a key role during an energy crisis. We also discovered how a Grafana Labs engineer once used Grafana as part of a sustainable farming system. (Bonus: Check out how an Arctic research team is visualizing weather station data with Grafana.)
Reducing data center carbon emissions
Sentry Software is the maker of Hardware Sentry, an IT monitoring software, and a large part of its business relies on maintaining optimal temperature conditions at its data centers — an operation that contributes to the company’s overall carbon footprint.
Recently, Sentry Software embarked on a journey to reduce that footprint by moderating electricity consumption at their primary data center in Paris. By implementing open standards and Grafana Labs technology, they developed a monitoring system with Grafana dashboards to more efficiently monitor electricity usage. The final result was a 19% reduction in AC energy used at the data center, which translated to a 7% reduction in carbon dioxide emissions year over year.
The best part? Because the entire monitoring system is built on open source solutions and open standards, anyone can replicate the company’s success. “This story could become yours, and you don’t need complicated enterprise solutions,” Sentry Software CEO Bertrand Martin said in a GrafanaCON 2023 talk.

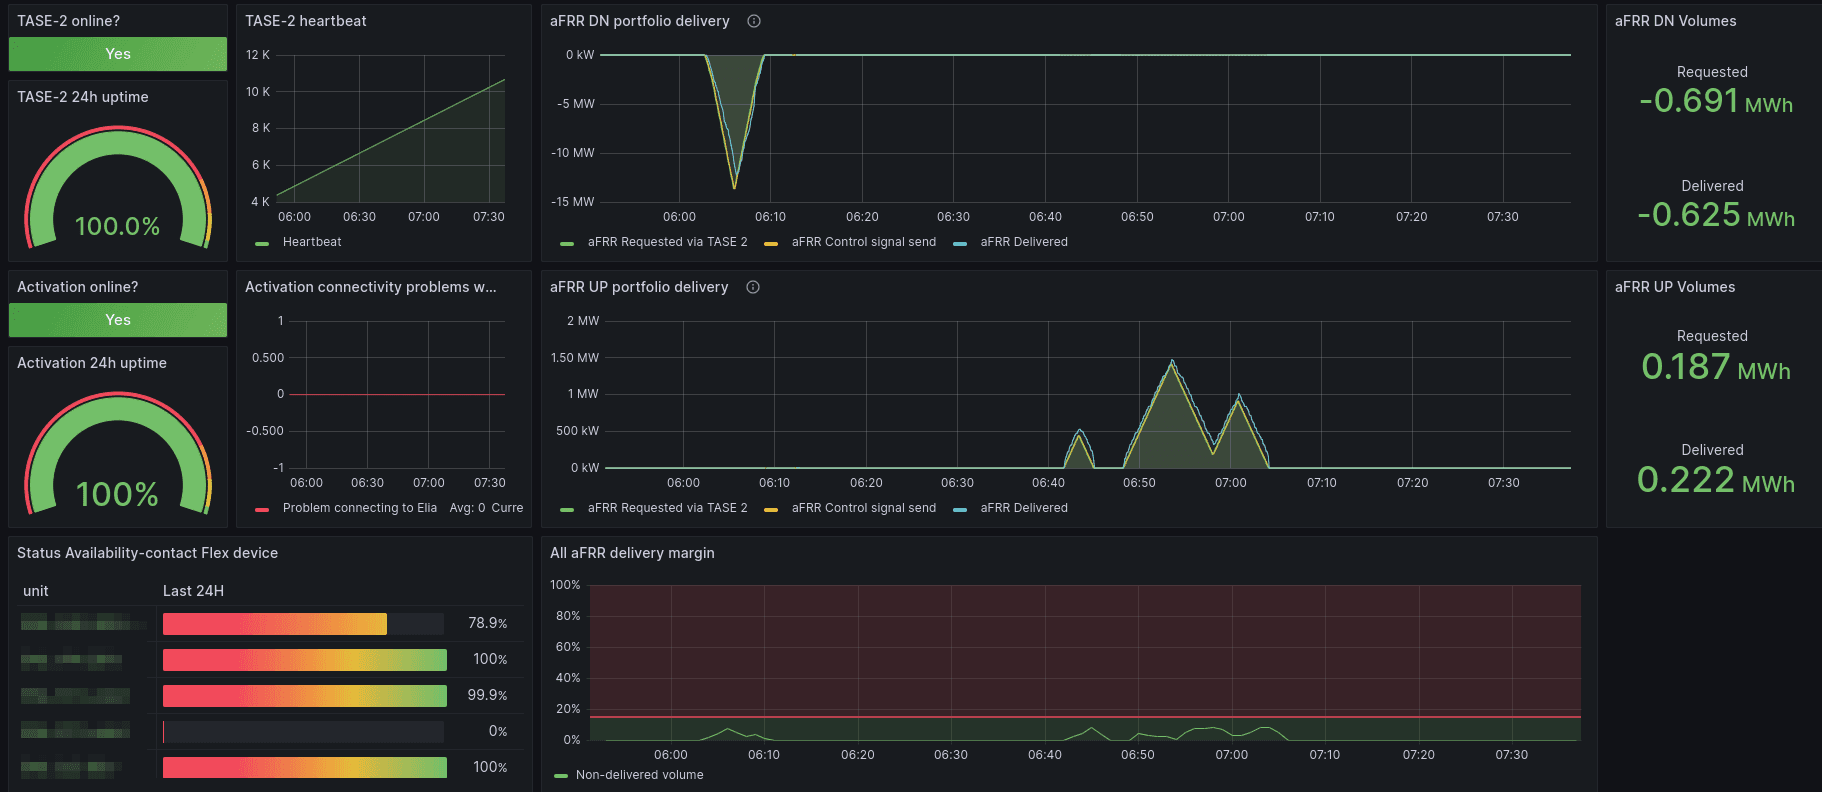
Balancing the power grid in France
Last winter, Flexcity — a market leader in electric flexibility — faced an unprecedented challenge: help French grid operator RTE stabilize the French national power grid in the midst of a widespread energy crisis that loomed over Europe. As the company made headlines for its efforts, Flexcity’s technical team credited Grafana Cloud for helping France get through that especially tough time. Using Grafana dashboards, the Flexcity team could track customers’ energy consumption metrics in real time — which, in turn, helped shave several GWh (Gigawatt hours) of electricity during the critical moments when the grid needed it the most.
“When we get a request from the grid operator, we use Grafana dashboards to see the energy and power consumption and production levels of our customer base in real time,” Mathias Deshayes, CTO at Flexcity, said. “We install small boxes at our customer sites and every four seconds we have their consumption sent to our platform and displayed in Grafana. So we have the sum of our portfolio in Grafana, and we can follow along with consumption during an activation, which is when a grid operator requests that a device adjusts its power, up or down, to help balance the grid.”
Overseeing a small farm
In his pre-Grafana Labs life, Senior Solutions Engineer Chris Wilkes built and operated a fish farm — technically an aquaponics farm. (Aquaponics combines aquaculture, which is the farming of fish, and hydroponics, which is growing vegetables in a liquid medium.) Wilkes was a novice farmer and admitted that quite a lot went wrong at the start of his endeavor. For example, at one point, all of his fish died after an air blower failed during the night.
After immersing himself in the world of IoT, “Every single piece of machinery on the farm got a microcontroller,” he said. Over time, a control and monitoring system evolved on the farm, and he used PubNub to query all the boards and then dump that data to a PostgreSQL database running on a central server (an old laptop in a shipping container). When he stumbled across a Grafana, he said, “it was like walking out of the dark cave and into the light.”
Wilkes ran the farm for about five years. “Grafana’s monitoring capabilities played an important role in how I managed and improved my farming techniques,” he said. He added that he plans to return to farming one day — with even more advanced Grafana skills to go along with his passion for sustainability. “We need to change the system by which we grow our food, especially in places where food is a scarce and uncertain resource.”

In the wild
We’re used to seeing Grafana dashboards pop up unexpectedly, but two in particular stood out to us this year.
The Ocean Race
Participants race around the world in this global sailing competition, which means they need around the clock monitoring of data that includes GPS location, wind speed, and air and water temperatures. Team Malizia, which represented Germany, shared the Grafana dashboard that helped them track their progress throughout the grueling six-month adventure. The Ocean Race headquarters also displayed some impressive Grafana dashboards as they monitored the overall event.

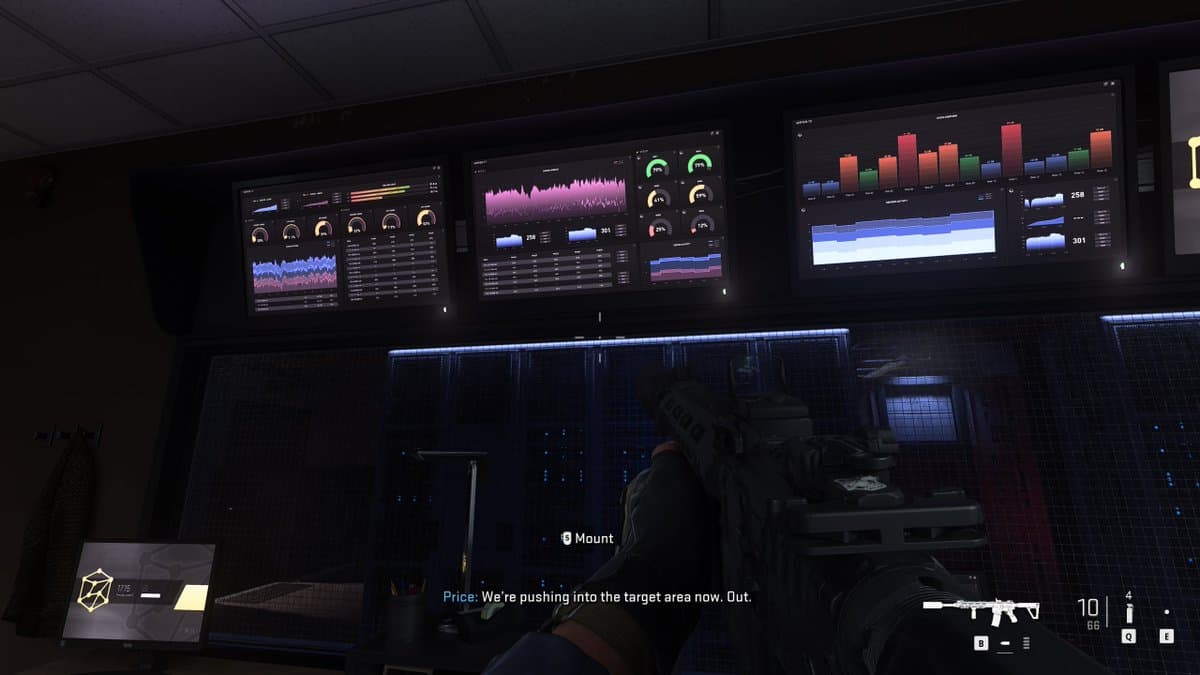
Call of Duty
Real world examples of Grafana dashboards are nothing new, but they’re being used in a virtual world, too. The image below is from the video game Call of Duty: Modern Warfare 2.
“It’s pretty obvious to those of you who know Grafana, that that looks a hell of a lot like Grafana, based on the style of the gauges, the color scheme, everything about it is clearly Grafana,” Grafana Labs CEO and Co-founder Raj Dutt said during the GrafanaCON 2023 keynote. “So whoever it was at Activision who is a Grafana fan and responsible for this, thank you! Big hat tip from all of us.”
We look forward to being dazzled by more dashboards in 2024!
Want to share your Grafana story and dashboards with the community? Drop us a note at stories@grafana.com.

