
Grafana Labs in 2023: Top 10 moments of the year
If you ask us to score 2023, we would give it a 10 out of 10.
Not only because we released Grafana 10 and celebrated the 10-year anniversary of the Grafana project with the first-ever Golden Grot Awards and the launch of a four-part documentary series. But also because we expanded our OSS offerings (welcome to the family, Grafana Pyrsocope and Grafana Beyla!) and our fully managed Grafana Cloud solution, which now includes Frontend Observability, Application Observability, cost management tools, and more.
“It’s been a pretty impressive journey in terms of the amount of innovation that we’ve done,” said Grafana Labs CEO and co-founder Raj Dutt during the opening keynote of ObservabilityCON 2023, adding, “I’m extremely proud of the way that we innovate at Grafana Labs. It’s not top down. It’s very much organic. It happens at the edges, from our incredibly innovative and talented engineering teams. It happens from feedback we get from the community.”
Here’s a look back at how the community and the company came together to make 2023 a year filled with memorable milestones.
1. Released Grafana 10.0
In 10 years, the Grafana ecosystem has only gotten bigger. There are now 20 million users worldwide and 150 data sources, both open source and commercial.
So it’s only natural that Grafana has also expanded with the release of Grafana 10.0. Along with new visualizations like the datagrid panel and trend panel, there were enhancements to the Grafana UI, as well as new ways to connect (correlations!), organize (subfolders!), and share (public dashboards!) all your data.
We also introduced Grafana Scenes, a new frontend library that allows you to build beautiful dashboard experiences right into your application plugins. For more information, check out Grafana Scenes on GitHub or watch the GrafanaCON session “How to build dynamic, customizable dashboards with Grafana Scenes.”
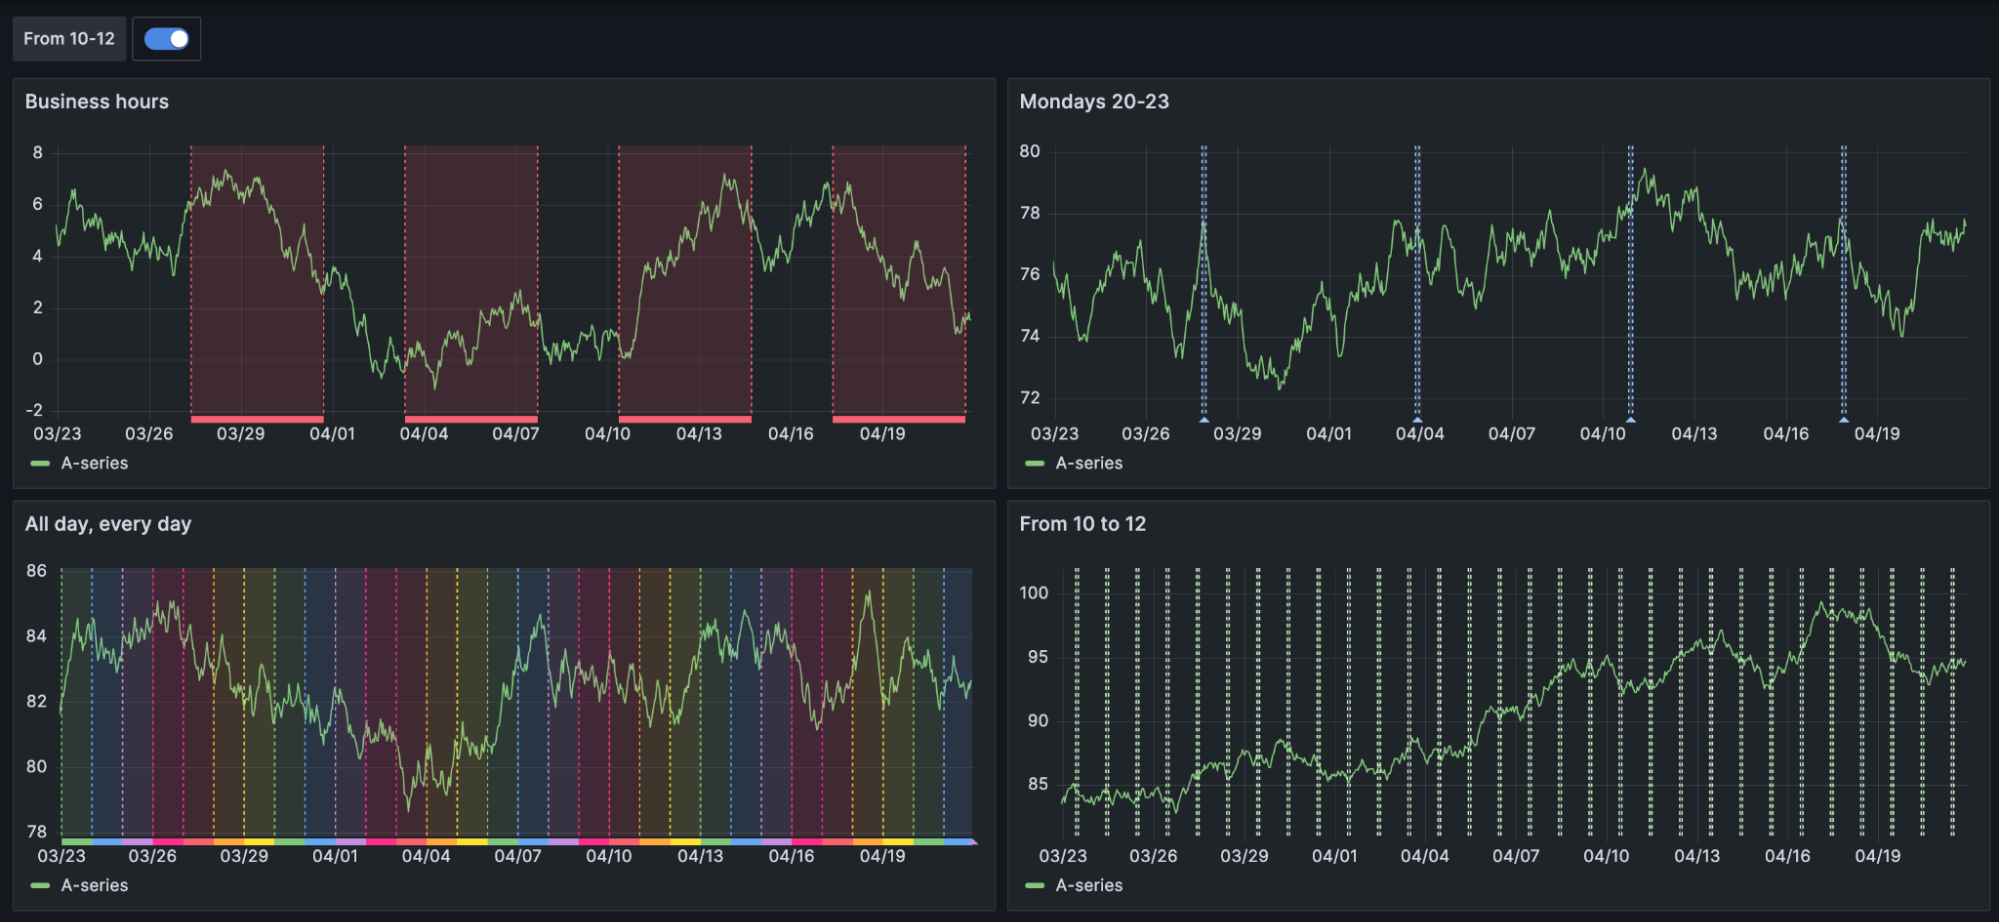
*The new trend panel in Grafana 10.*")
You can also check out our Grafana blog posts and Grafana documentation to learn more about Grafana 10, the latest minor releases, and new features we released throughout the year.
2. Launched Grafana Tempo 2.0
This year marked the latest major release of Grafana Tempo, the open source, easy-to-use, highly scalable distributed tracing backend. With Tempo 2.0, we rolled out the Apache Parquet trace storage backend and introduced TraceQL, a new language designed for discovering traces in Grafana Tempo. Inspired by LogQL and PromQL, TraceQL gives Tempo capabilities that cannot be found in any other open source tracing solution, making it the fastest way to get precisely what you’re looking for in your traces.
Learn more in our Tempo 2.0 blog post and Tempo documentation.
3. Celebrated Grafana Loki turning five
At KubeConNA 2018, David Kaltschmidt, now a Senior Director of Engineering at Grafana Labs, clicked the button to make the Grafana Loki repo public, live and in front of the sold-out crowd.
Five years later, the project has surpassed 20,000 stars on GitHub. There are also well over 100,000 active Loki clusters today, and we see Loki out in the wild in a wide range of use cases — whether it’s running on Raspberry Pis in homelabs or on massive multi-tenant clusters with tens of thousands of CPU cores. Above all, we are grateful for the community of almost 900 contributors who helped evolve what started as a prototype into an impressive, extremely capable piece of software.

To learn more about the project and what’s next for Loki 3.0, read our concise guide to Loki.
4. Introduced Grafana Beyla
For those who want to use Grafana for application observability but don’t have time to adapt their application for it, we created an auto-instrumentation tool that solves that problem. In November, we announced the general availability of Grafana Beyla, a vendor-agnostic, open source eBPF auto-instrumentation tool that is compatible with OpenTelemetry and Prometheus applications. Beyla reports span information for basic transactions as well as RED metrics (Rate-Errors-Duration) for both Linux HTTP/S and gRPC services — all without requiring any code modification to manually insert probes.
To learn more, you can find Grafana Beyla on GitHub and check out our Grafana Beyla documentation, which includes a guide to deploying Beyla in Kubernetes and more.
5. Launched Grafana Pyroscope
In March, Grafana Labs acquired Pyroscope, the company that created the popular open source continuous profiling project of the same name. Within five months, we announced the general availability of Grafana Pyroscope 1.0, the first release of the continuous profiling tool that combines Pyroscope with Grafana Phlare, a horizontally scalable, highly available open source profiling solution. (Pyroscope also powers Grafana Cloud Profiles.)

Grafana Pyroscope 1.0 is built to ingest, store, and query workloads from any project of any size. We’ve tested it thoroughly and seen ingest rates at petabyte scale, profiling more than 50,000 application instances from around the world and more than 6,000 unique profiles per second.
With Pyroscope, developers gain a deeper view into the resource usage of their code down to the line number. Case in point: A Grafana Labs engineer used continuous profiling to help identify the resource consumption of a Grafana Loki feature and learned how to make his code more efficient.
Learn more on our Grafana Pyroscope web page and in our Pyroscope documentation.
6. Acquired Asserts.ai
Recently, the biggest needs we’ve heard from our customers have been to make it easier to understand their observability data, to extend observability into the application layer, and to get deeper, contextualized analytics.
To that end, Grafana Labs acquired Asserts.ai, a startup built to provide an easier way to explore telemetry and derive new insights for more efficient root cause analysis and faster issue resolution. Asserts serves as a contextual layer for Prometheus metrics and provides out-of-the-box insights into the relationships among various system components over time (for example, what application is running on which pod, node, namespace, etc.) to enable users to better understand and navigate their applications and infrastructure. This layer is also used to build sophisticated, easy-to-use experiences for troubleshooting alerts, querying data, and automatic baselining.
“It’s a little surreal because a year ago in New York City I was sitting out there like you, learning all about what’s new at Grafana Labs,” says Manoj Acharya, founder of Asserts.ai, during ObservabilityCON 2023. Now part of Grafana Labs, Asserts will be incorporated into Grafana Cloud so users can better understand their observability data and find issues more quickly, from the infrastructure to the application layer.
Asserts in Grafana Cloud will be available in private preview soon. For more information, read our blog post about the Asserts.ai acquisition.
7. Extended the Grafana Cloud stack
Beyond the core Grafana LGTM Stack, customers can extend their observability strategy with a new slate of offerings that we introduced this year, including:
- Frontend Observability for real user monitoring
- Grafana Cloud k6 for performance testing
- Application Observability for monitoring applications and minimizing MTTR
- Grafana Cloud Profiles for continuous profiling at scale
- Grafana SLO for creating and managing SLOs
We also introduced ways to lower bills while increasing efficiency in Grafana Cloud. Adaptive Metrics (GA) is a tool for aggregating unused or partially used metrics into lower cardinality versions. There’s also the Log Volume Explorer (public preview) for investigating the source of high log volumes. Finally, we added the Usage Attribution Report (public preview) for analyzing monthly metrics usage by teams. All of these tools can be accessed through the new cost management hub now available in Grafana Cloud.
For more information, check out our Grafana Cloud web page.
8. Rolled out the Golden Grot Awards
We launched our first-ever awards program recognizing Grafana community members, their stunning dashboards, and the world’s general need for a shiny Grot-shaped trophy.
At GrafanaCON 2023 in June, we presented the inaugural winners of the Golden Grot Awards: Nicky Sonnemans in the personal dashboard category and, in the professional category, Raymond Sowden, the CNC Team Lead at RadixTrie PTY LTD, who built a Grafana dashboard to monitor Oracle’s JD Edwards EnterpriseOne ERP (JDE).

“Being recognized by Grafana and the judges is very humbling," says Sowden, who credits the Grafana community for a big part of his win. “Most of the things I’ve been able to do have been thanks to the community. If there wasn’t a community of other people having gone through the same challenges, I would have been logging tickets and opening issues on the GitHub sites.”
Read more about the Golden Grot Awards.
9. Landed on the Forbes 100 Cloud list and more
There’s New Year’s Eve and then there’s the other reason crowds should come together in New York City’s Times Square every year: To see the names of the Forbes Cloud 100 list flash on the Nasdaq Tower.
We were thrilled to rise 11 spots up to #18 on the prestigious Cloud 100 list, which recognizes standout private cloud companies. Grafana Labs also landed on Forbes’ list of America’s Best Startup Employers, and was named a finalist in the InfoWorld Technology of the Year 2023 honors.

10. Premiered the ‘Story of Grafana’ documentary series
A year in the making, “The Story of Grafana” is a four-part documentary that dives into the origin story of Grafana, which started with one engineer who wanted to visualize time series data and grew to become a thriving open source community with more than 20 million users worldwide.
The Grafana documentary features more than 20 interviews, including conversations with Grafana Labs co-founders; early Grafana engineers Carl Bergquist and Daniel Lee; and other voices from across the global open source community who have made contributions and continue to shape Grafana.
You can watch the first two episodes, “Democratize Metrics” and “Community,” now on YouTube. More episodes will drop in the new year, highlighting the business of open source and the innovation that’s powering the next 10 years and beyond. (P.S. You’ll also learn some Gra-folklore, such as how Grafana got its name and the story behind the “night sandwich.”)
“There have been a bunch of people in the community over the last 10 years who have been in the inner circle in many ways, even though they don’t work at Grafana Labs,” says Grafana Labs CEO and co-founder Raj Dutt in the series. “I hope that they feel a sense of pride in what they’ve been a part of.”


