Grafana Alerting: How to monitor alerts for better alert management
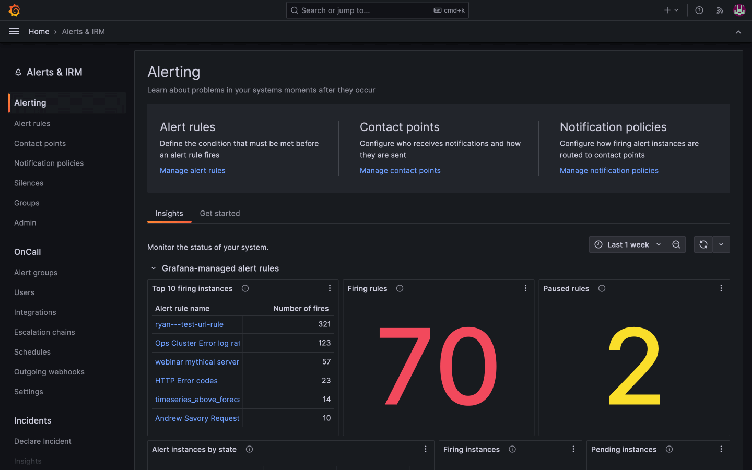
With the release of Grafana 10.2, we made a number of enhancements to Grafana Alerting. These updates included the rollout of Insights, a new section of the Grafana Alerting home page. Available now to all Grafana Cloud users, Insights offers valuable information, such as statistics on alert rules and notifications, to help you monitor alerting data and quickly analyze alert performance.
You can access Insights directly on the revamped Grafana Alerting home page, which also includes a dedicated Get started section. (Note: existing Grafana Alerting users will already be familiar with the contents of the Get started section, as it contains all the introductory Grafana Alerting information that was on the homepage previously.)

Insights displays a set of predefined panels that help users monitor alerting data, discover key trends about their organization’s alert management performance, and find patterns that suggest why things go wrong.
Insights in Grafana Alerting: Key features and subsections
The Insights section in Grafana Alerting includes a time selector that enables users to designate their preferred time range for visualizations, offering flexibility in both relative and absolute configurations. Additionally, users can enable an auto-refresh setting on the page to view information in real time.
The Insights page is divided into subsections to group panels based on data source. This helps organize things and makes it easier for users to find and understand relationships within each subsection.
These 5 subsections are:
- Grafana-managed alert rules
- Grafana Alertmanager
- Mimir-managed alert rules
- Mimir-managed alert rules - per rule group
- Mimir Alertmanager
Let’s take a closer look at each.
Monitor Grafana-managed alert rules
This subsection helps your monitor your Grafana-managed alert rules and provides information such as:
- The alert rule instances that have fired the most
- The number of currently firing alert rules
- A breakdown of your alert rule instances by state
- The number of currently active or paused alert rules
- The presence of evaluation failures and missed evaluations

Monitor Grafana Alertmanager
This subsection gives an overview of Grafana Alertmanager and provides:
- A breakdown of your firing alert rule instances based on whether they are currently active, suppressed (silenced or muted), or unprocessed
- Information about the types of silences in your system

Monitor Mimir-managed alert rules
This subsection offers insights into your Mimir-managed alert rules from the specified data sources and provides information, such as:
- The alert rules that have fired the most
- The number of currently firing or pending alert rule instances
- The presence of evaluation failures and missed evaluations

Monitor Mimir-managed alert rules - per rule group
This subsection helps you track your Mimir-managed alert rule groups from the specified data sources and provides information, including:
- The number of successful and failed evaluations
- The evaluation interval
- The number of alert rules in the group
- How long it took to evaluate the alert rules in the group
- The percentage of the evaluation interval spent evaluating alert rules

Monitor Mimir Alertmanager
This subsection gives an overview of Mimir Alertmanager for the specified data sources and provides information, such as:
- A breakdown of your firing alert rule instances based on whether they are currently active, suppressed (silenced or muted), or unprocessed
- Information about the types of silences in your system
- The number of successful and failed notifications
- Whether your Alertmanager configuration is invalid

Collecting your feedback
As you start to use these panels in Insights, we want to know which ones are useful to you — and which ones aren’t — so we can continually improve them.
To provide your feedback, simply click on the menu bottom in the top right corner of a panel, and select Rate this panel. This will open a popup where you can tell us whether you find the panel useful or not. We appreciate your input!

Learn more about alert management in Grafana Alerting
The new Insights tab in Grafana Alerting is a handy tool to keep an eye on the status of your systems and understand how your organization is performing, in terms of alert management. It simplifies monitoring and gives you practical visualizations to more easily identify and address issues.
Insights is one of several features we’ve added to Grafana Alerting to provide users with more visibility into their alerting data. Earlier this year, for example, we rolled out an alert state history system that leverages the querying capabilities of Grafana Loki to help you analyze and create dashboards related to alert behavior.
To learn more about Grafana Alerting, check out our technical documentation.
Grafana Alerting is available for Grafana OSS, Grafana Enterprise, or Grafana Cloud. The easiest way to get started is with Grafana Cloud’s generous forever-free tier. Sign up for free now!


