Traces to metrics: Ad hoc RED metrics in Grafana Tempo with 'Aggregate by'
In observability, finding the root cause of a problem is sometimes likened to finding a needle in a haystack. Considering that the problem might be visible in only a tiny fraction of millions or billions of individual traces, the task of reviewing enough traces to find the right one is daunting and often ends in failure.
A more effective strategy is to segment this giant haystack into several smaller ones. By studying the shape of these smaller haystacks and identifying the problematic ones, you significantly narrow your search space. The needle, or the specific trace you’re looking for, is now confined to a much smaller haystack. This transforms an overwhelming task into a manageable one, increasing your chances of quickly finding the needed information.
The key is to set up your observability stack to make it easy to slice your traces along different dimensions, making the process of shrinking your haystack as quick and effective as possible.
If you know how you want to segment your trace data ahead of time, Grafana Tempo’s metrics-generator is fantastic. It looks at incoming spans, and calculates RED metrics from them, which it then writes to a time series database like Prometheus. By querying Prometheus, you can see the overall request rate, erroring request rate, and distribution of request latency in your system. And by using the labels on those metrics, you can get a more granular view of request rate, error rate, and latency at a per-service, per-namespace, or per-operation level. This helps you zero in on where exactly the problem is happening. For example, the error rate may only be elevated for a particular HTTP API endpoint, or latencies may only be spiking for a particular set of your services.
However, there is only so much dimensionality that it is practical to keep in these metrics. You likely don’t want to compute request rate, error rate, and latency for every single combination of IP address, browser type, instrumentation version, and application version seen in your incoming spans. By doing so, you could end up with a cardinality explosion — hundreds of millions of time series getting written to your time series database. This can crash your database, or make it prohibitively expensive to run.
The practical reality of this scenario is frustrating! Being able to compute RED metrics grouped by arbitrary attributes can be really valuable during an investigation. It might let you observe that only a specific IP address has an elevated rate of erroring spans, or that only requests for a specific product ID are the ones showing high latency. You can’t see that if you can only compute RED metrics at a per-namespace or per-operation level.
Enabling ad hoc RED metrics in Grafana Tempo
So how do I get what I want then?
The solution is to compute ad hoc metrics at query time. Rather than constantly computing and storing zillions of time series to a TSDB representing every possible combination of every single attribute on your spans, just compute metrics on-the-fly from the spans stored in your tracing database at query time. This way, you only compute what you’re actually interested in, when you’re actually interested in it.
This is something we’ve already done with Grafana Loki, and I’m excited to say that we’ve hit a first milestone in delivering on this in Tempo. With our new aggregation functionality, you can see request rate, error rate, and latency values of your system over the last hour, computed from your trace data. And you can see those values broken down by any and all attributes attached to your traces.
We’ve already had numerous positive reviews from early adopters of the feature, including investment platform Sarwa. “Our team has been using the Aggregate by feature very effectively,” says Muhamed Saudi, DevOps Engineer at Sarwa. “We’ve built a table panel showing RED metrics aggregated by endpoint, which we’ve embedded in each application’s dashboard. Using that table we were able to swiftly identify an old API endpoint that had a 100% error rate.”
How ‘Aggregate by’ works
As a Grafana Cloud customer, you’ll see a new Aggregate by button in the Tempo Explore view. (If you’re not already using Grafana Cloud, you can sign up for a forever-free account today.) Open source Tempo users have access to this too — just set the metricsSummary feature toggle on your open source Grafana and enable the metrics summary API on your Tempo database.
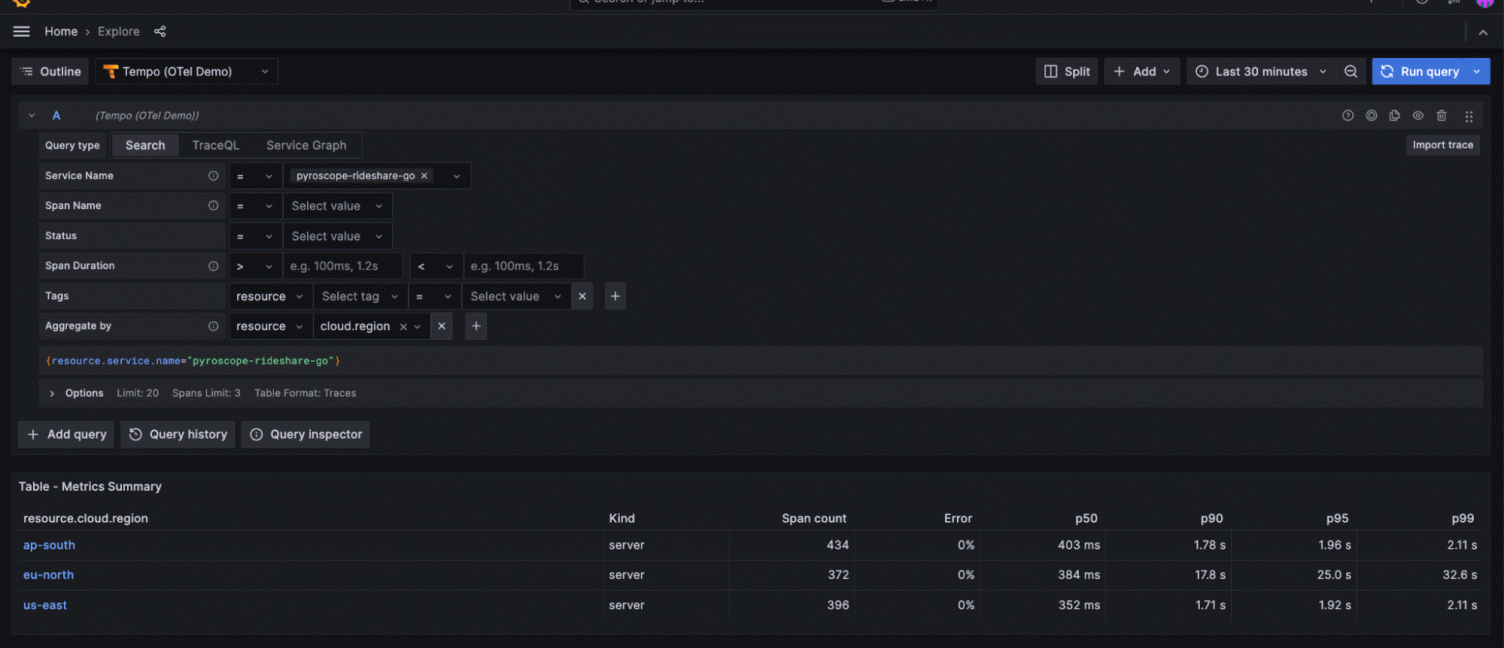
To start, select an attribute to aggregate by. When you click Run query, you’ll get a table with RED metrics (total span count, percent erroring spans, and latency information) grouped by the attribute(s) you chose. If you choose to aggregate by resource.cloud.region, for example, and you have three regions — US, EU, APAC — you’ll get back a table with three rows, with each row detailing the RED metrics for spans from that particular region.

pyroscope-rideshare-go grouped by cloud region.From here, you might notice that only traces going through the EU region are showing elevated latencies, allowing you to focus your investigation on the EU while ignoring anything coming from the US and APAC.
 and us-east (1.92s).*")
pyroscope-rideshare-go service belonging to the ‘eu-north’ region is 25.0s. This is significantly higher than the latency for spans of that same service in ap-south (1.96s) and us-east (1.92s).Now, you can communicate back to your team that the latency problem seems to be contained to a particular area, rather than being system-wide. To continue your investigation, simply click on “eu-north,” which will open a split screen showing you traces specifically from that region.

Mario Rodriquez, Senior Software Engineer at Grafana Labs, highlighted this feature at ObsCon London in November.
Under the hood, when you use the “Aggregate by” option, Grafana makes a call to Tempo’s metrics summary API, which returns these RED metrics based on spans of kind=server seen in the last hour.
Next steps for traces to metrics
When we asked our early adopters what they would change about this new feature, the feedback we heard was really just, “I WANT MORE.” They want these ad hoc metrics over more than just the last hour of spans, and they want them over more than just spans of kind=server. The good news: We do too, and we’re actively working on it.
Our North Star vision is to make it possible to ask for these on-the-fly metrics using TraceQL queries, the same way you can today with LogQL metrics queries like this one:
sum by (host) (rate({job="mysql"} |= "error" [1m]))For each host, that query calculates the rate of log lines with the label job=mysql that have the word “error” in them over the last minute. We expect that we’ll have the first version of this in TraceQL sometime in early 2024. You’ll be able to do something like the example below, which calculates the rate of received spans belonging to serviceA, for each value of method:
{ service="serviceA" } | rate() by (method)After that, we’ll add more functionality, like the ability to calculate percentiles, minimums, and maximum values.
Persistent vs. ad hoc metrics from traces
The “Aggregate by” feature is a stepping stone on the way to the future of powerful, flexible query-time metrics from traces. In that glorious future, you’ll be able to do crazy things like “compute the 99th percentile latency of all spans for serviceB whose parent span is from serviceA for each namespace.” Here’s what the TraceQL for that might look like:
{ resource.service.name="serviceA" >> resource.service.name="serviceB" } | quantile_over_time(duration, 1m, 0.99) by (resource.namespace)
So why not just compute metrics on-the-fly and completely dispense with persisting them to a separate time series database? Ultimately, we see uses for both persistent and ad hoc metrics from traces, just like we already have uses for both persistent (via Loki recording rules) and ad-hoc (via LogQL metrics queries) metrics from logs.
Persistent metrics
Persistent metrics that get written to a time series database are great for quantities you know you want to record ahead of time. You compute them at ingestion and store them so they’re already pre-computed when you go to query them, which generally means a faster query. Most people also tend to have longer retention on their time series than on their raw trace data, so they can visualize these metrics over a longer time period. At Grafana Labs, for example, we retain time series data for 13 months, but traces for only 30 days.
A good example of metrics to persist are standard RED metrics segmented by the most common attributes — e.g., service name, namespace, k8s-cluster. Basically, the attributes you know that you’ll most often look at and filter by when you start your investigation.
Ad hoc metrics
Ad hoc metrics are great for answering unknown-unknown questions about your system. You can only look back over the period for which you retain your raw traces (or logs), which tends to be shorter. However, you can answer questions that you never would have thought to ask if not for some incident (e.g., I need the max duration of all spans with customer_id=1234).
There’s no way you would have know to compute this metric specifically for customer_id=1234 ahead of time, and if you had been calculating that metric for all customer IDs over time and storing that to your Prometheus-compatible database, you probably would be contending with a very hefty infrastructure bill!
Learn more about traces to metrics in Grafana
We’re excited to see what users do with this new “Aggregate by” functionality. At the same time, we’re actively working on our longer term plans to make this kind of ad-hoc metrics-from-traces computation possible directly in TraceQL, the querying language for Tempo and Grafana Cloud Traces.
We’d love to hear what you think. Reach out to us on Slack, GitHub, or in the Community Forum!
Grafana Cloud is the easiest way to get started with metrics, logs, traces, dashboards, and more. We have a generous forever-free tier and plans for every use case. Sign up for free now!