
Monitoring Microsoft Windows with Grafana Cloud: new updates
Windows is widely used by developers, businesses, and individuals alike. Renowned for its adaptability, security, and reliability, the operating system is a preferred choice for servers, desktops, and embedded devices. It also holds a significant presence in the cloud, serving as the foundation for numerous major websites and applications.
Given its widespread adoption, it’s no surprise that our Windows integration is one of the most popular Grafana Cloud solutions for monitoring third-party software through prebuilt dashboards, metrics, and alerts. And that’s why we are thrilled to announce recent enhancements that elevate the utility of the Windows integration for Grafana Cloud!
These updates contribute to a more comprehensive and user-friendly Windows integration for Grafana Cloud, catering to the diverse needs of users in different environments, including those that need to manage both Linux and Windows. Here’s a snapshot of the key improvements:
- Linux monitoring parity. We’ve synced the Windows dashboards style and experience with the ones used in our Linux integration.
- Three-tier view. Monitor Windows nodes with new dashboard types: fleet view, node-specific overview, and advanced drill down.
- Enhanced navigation. Use data links for smoother transitions between different dashboards.
- New alerts. Get improved control over Windows instances by tracking high resource usage or other issues.
- Grafana annotation integration. See crucial events such as system reboot, critical system errors found in logs, and failed Windows services.
Why the Windows integration update is important
Generic operating systems dashboards
We believe that monitoring-as-code is the right approach to create modern observable systems. Therefore we build our integration dashboards using tools like the recently revamped Jsonnet library called Grafonnet. Jsonnet’s flexibility and Grafonnet’s full support of Grafana schema version 10 and higher made it possible for us to build our own helper libraries on top of them, such as commonlib or logs-lib.
But what does this mean for our Grafana Cloud user? Simply put, with the new tool stack we can modularize different parts of dashboards, such as commonly used panels; we define them in one place, then reuse them in many places. This means we can easily provide dashboards and integrations with common styles and user experience.
And that is exactly what happened here, with dashboards layouts and panels styles of Linux and Windows integration being as close to identical as possible. For example, here is Linux integration overview dashboard:

And here is Windows integration, with the similarly designed dashboard:

Many companies use a mix of Windows and Linux, so having a similar look and feel across dashboards should make it easier for engineers to keep tabs on all of those environments in Grafana Cloud.
Fleet view
Previously, the Windows integration was primarily focused on analyzing metrics and logs from individual instances. However, in a production environment where control extends to hundreds of thousands of VMs, navigating through all of those VMs becomes a complex task.
Identical to the Linux integration fleet view, the Windows fleet view dashboard serves as a comprehensive solution, providing a unified perspective to identify any issues or anomalies with your nodes.

In this dashboard, a table view presents essential stats and information for all your nodes. Beneath it, graphs showcase the top 25 nodes categorized by CPU, memory/disk, and usage, facilitating the identification of high resource usage or saturation.
Once you spot an issue in a dashboard, you can leverage table links or data links from your graphs to seamlessly transition to the specific host for a more detailed inspection. The Windows fleet view dashboard, in conjunction with the Linux fleet view dashboard, forms a critical part of the tool set designed to streamline VM fleet management connected to Grafana Cloud.
Overview dashboard
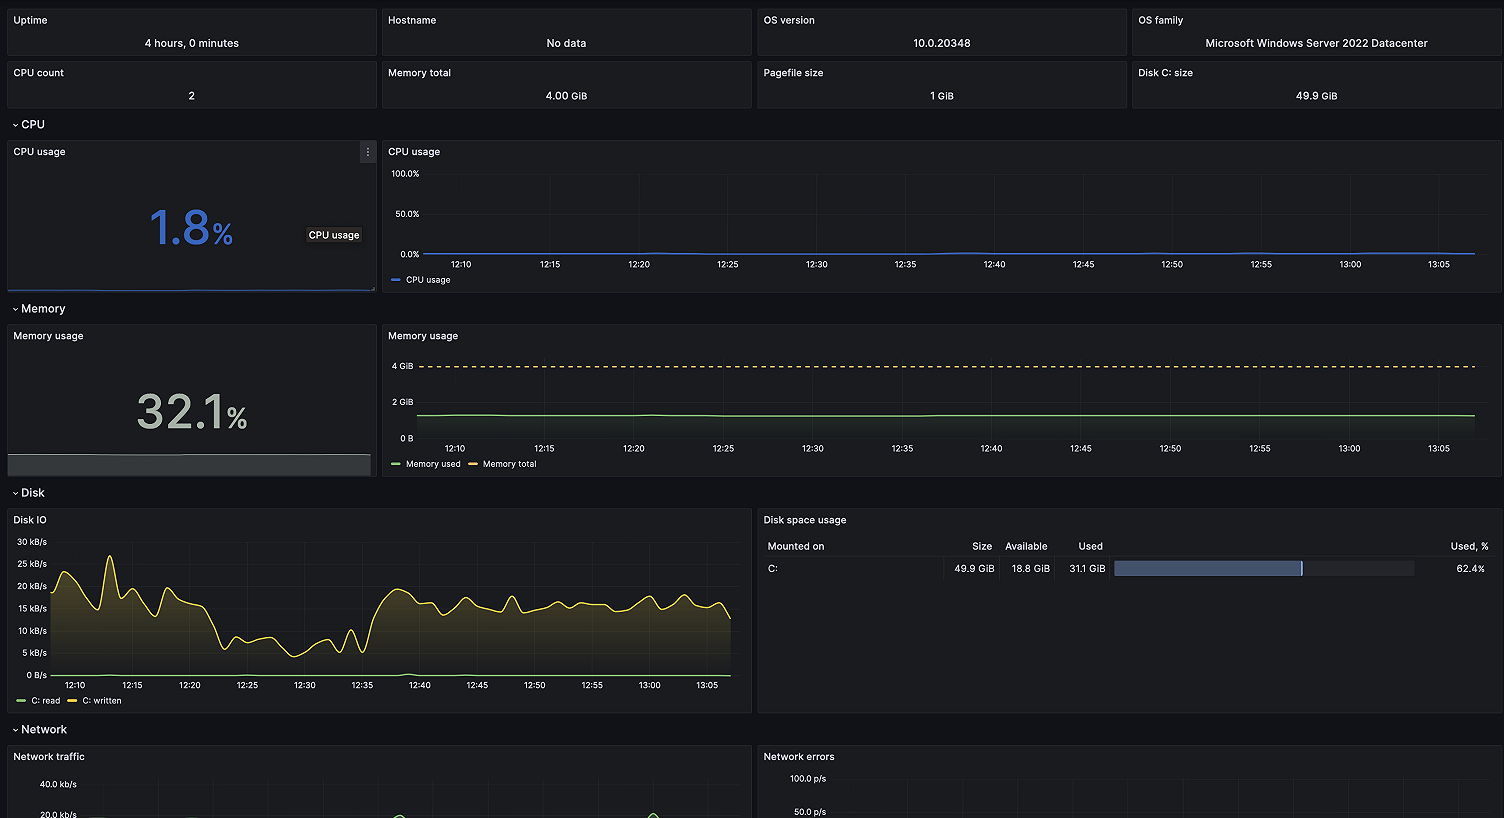
The overview dashboard is yet another example of how we’ve mirrored what we’ve done in our Linux integration. When you click on one of the links in your fleet view dashboard, it takes you to the overview dashboard, which gives you the most useful metrics about a specific node. In addition to existing CPU, memory, disk, and network metrics views, the updated Windows integration adds a new informational row on the top. This gives you a better idea of which instance you are looking at, and what resources are provisioned.
To explore specific resource groups like memory or network metrics in more detail, simply navigate to the corresponding drill-down dashboards.
Drill down dashboards
Let’s say you suspect a logical disk issue with the node. You can find more disk performance metrics and their trends by jumping to the filesystem and disks dashboard from the overview dashboard by clicking on Other Windows dashboards.

Drill down dashboards are also available for viewing logs, CPU, and system. For example, here is the logs dashboard where you can select different event channels, sources, and severity levels, as well as correlating logs across multiple Windows hosts:

New alerts
For extensive Windows fleets, the new fleet view, coupled with alerts, plays a crucial role in monitoring and addressing potential issues. This update includes three additional alerts designed to track instances of high resource usage or other issues on the nodes. For instance, WindowsNTPTimeOffset alert could help you spot system clock synchronization delays and failures.
Grafana annotations to correlate events and metrics
As we pointed out in our Linux integration blog post, events can be an important signal in your observability strategy, and Grafana annotations are superb for visualizing critical events and correlating them with metrics trends.
In this update, we added three events as annotations: System reboot, Critical event in logs, and failed windows service.

Use the new and improved Windows integration today
With this update to the Windows integration, we set out to make it easier than ever to monitor multiple operating systems in Grafana Cloud. With a familiar experience and style across both Linux and Windows, you’ll feel comfortable visualizing different environments and drilling down when issues arise, regardless of which environment it’s happening in.
Give our Windows integration a try, and let us know what you think! If you already have Windows integration installed, don’t forget to update it in our Connections console. You can reach out to us in our Grafana Labs Community Slack in the #Integrations channel.
Grafana Cloud is the easiest way to get started with metrics, logs, traces, dashboards, and more. We have a generous forever-free tier and plans for every use case. Sign up for free now!


