Observability with Grafana Cloud: Explore the latest and greatest features
Grafana Cloud constantly evolves to include new, cutting-edge features for end-to-end observability.
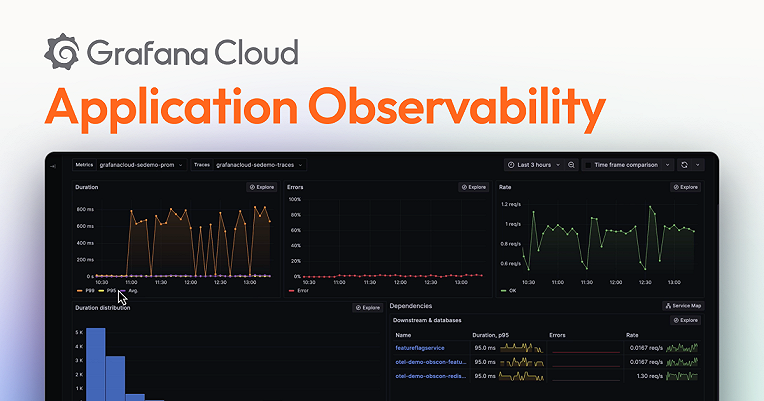
In fact, just last month at ObservabilityCON 2023, we made a number of updates to our fully managed observability platform, including the general availability of Grafana Cloud Application Observability, Grafana SLO, and Adaptive Metrics. Together, these new features help users accelerate root cause analysis, manage and track service level objectives, optimize observability costs — and so much more.
To learn about these and other Grafana Cloud features, check out the on-demand ObservabilityCON 2023 sessions below. In some of the videos, Grafana Labs experts provide an overview of a particular Grafana Cloud solution, and offer best practices for getting started. In others, you’ll get a chance to hear success stories and lessons learned directly from Grafana Cloud users. Either way, you’ll walk away with a better understanding of how Grafana Cloud can help drive your organization’s observability strategy.
A closer look at new Grafana Cloud features
Unify your application and infrastructure observability
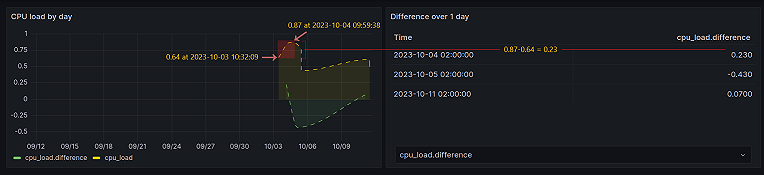
In cloud native environments, finding and resolving issues across services and between application and infrastructure dependencies can be challenging. In this session, led by Grafana Labs Engineering Director Myrle Krantz and Senior Software Engineer Bogdan Matei, you’ll learn about Grafana Cloud’s latest capabilities for correlating application and infrastructure observability. You will also hear how we unify and contextualize service relationships and application and infrastructure dependencies to help you resolve problems faster.

Access the on-demand session here.
Manage rising metrics and logging costs with Grafana Cloud
Are your SRE and platform teams under pressure to ingest fewer metrics and logs in the name of cost savings? Reducing costs does not have to mean reduced observability. In this session, Grafana Labs Senior Group Product Manager Jen Villa and Senior Software Engineer Mauro Stettler, walk through the cost management features in Grafana Cloud that allow you to analyze, attribute, monitor, and optimize your metrics and logs usage — and lower costs — without compromising your observability strategy.

Access the on-demand session here.
Prioritize critical resources with SLO-driven IRM
A majority of respondents in our Observability Survey said they were using SLOs or moving in that direction. For good reason: By highlighting the most critical error budget burndown, service level objectives (SLOs) can help you prioritize performance issues based on business impact. In this session, Grafana Labs Principal Software Engineer Josh Abreu Mesa and Senior Software Engineer Reem Tariq walk through how Grafana Cloud’s integrated SLO and Incident Response Management capabilities can help you identify the most important issues and resolve them quickly.

Access the on-demand session here.
Grafana Cloud user stories
Actian & Grafana Cloud: The search for a customizable observability tool
Over the past few years, Actian has shifted from offering a solely on-premises data integration, management, and analytics product to supporting hybrid and multi-cloud environments as well. To keep up, the team needed a customizable observability tool, and found it in Grafana Cloud. Lead Cloud Operations Engineer Suleyman Kutlu shares his team’s journey, starting with metrics and logs, and venturing into load testing, frontend observability, IRM, and more.

Access the on-demand session here.
With OpenTelemetry, ComplyAdvantage overhauled its observability (twice)
ComplyAdvantage, which provides compliance and risk management tools, has overhauled its observability platform twice in two years, first moving from on-prem Grafana OSS to Datadog, and then migrating from Datadog to Grafana Cloud. Join Principal SRE Adam Wilson to hear how his team’s approach to observability evolved, and how their increased OTel usage made it possible to migrate twice — and to get the most out of Grafana Cloud for metrics, logs, traces, Kubernetes monitoring, and more.

Access the on-demand session here.
We want to hear from you!
We want to learn more about your observability practices, challenges, and goals. Grafana Labs has launched our second annual observability survey, and we’d love you to take part. (It only takes 5 minutes, we promise!) All answers will be anonymous — plus did we mention there’s an opportunity to earn some Grafana swag?
Check out all of our webinars and on-demand conference videos for in-depth demos, deep dive discussions, helpful Q&As, and more!