Grafana Agent v0.38 release: new OpenTelemetry components, configuration improvements, and more
Grafana Agent v0.38 has hit the digital shelves just before the holiday season! 🧑🎄
The elves over at Grafana Labs have been quietly working on Grafana Agent, with more than 50 updates for all SREs and developers to use — no matter if you’re on the naughty or nice list. This includes new features, improvements, bug fixes, and significant ease-of-use changes.
You can take a look at the CHANGELOG for the full list of changes as well as our upgrade guide for breaking changes, but in the meantime, here are some of the highlights.
New OpenTelemetry components and more
In the latest release, we’re excited to introduce new OpenTelemetry components for Grafana Agent Flow mode.
In this release, you can now use otelcol.processor.filter to filter OTLP data using the OpenTelemetry Transformation Language (OTTL), as well as otelcol.receiver.vcenter to receive telemetry from VMware’s vCenter.
Furthermore, you can use the pyroscope.ebpf component to profile your Python applications, and loki.write features a new queue-based client for shipping logs to multiple Grafana Loki instances without any blocking behavior.
Configuration improvements
The Grafana Agent v0.38 release also includes two improvements to the Grafana Agent Flow configuration.
River, the configuration language used in Grafana Agent Flow mode, now supports Go-style raw strings using backticks (`). No more guessing how many backslashes you need to escape that gnarly regex filter!
// before
stage.match {
selector = "{app=\"my-app\"} |~ \"name=(\\\\w+)\\\\s\""
…
}
// after
stage.match {
selector = `{app="my-app"} |~ "name=(\w+)\s"`
…
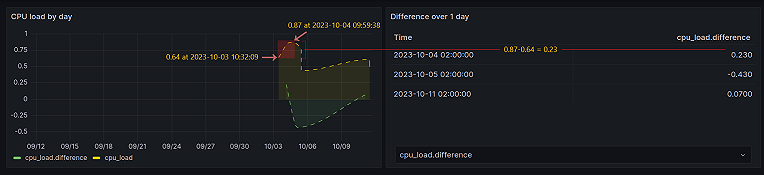
}Also, using [] to access non-existing keys in an object now returns a null value instead of generating an error. Along with using the coalesce function, you can use this to build more robust pipelines.
The following example showcases this new functionality along with the remote.kubernetes.secret component for defaulting to a different set of credentials if the secret does not exist.
remote.kubernetes.secret "credentials" {
	name      = "prometheus"
	namespace = "grafana-agent"
}

prometheus.remote_write "default" {
	endpoint {
		url = "https://prometheus-prod-01-eu-west-0.grafana.net/api/prom/push"

		basic_auth {
			username = coalesce(nonsensitive(remote.kubernetes.secret.credentials.data["username"]), env("PROM_USERNAME"))
			password = coalesce(remote.kubernetes.secret.credentials.data["password"], "defaultpassword")
		}
	}
}
Better log collection
The v0.38 release comes with improvements to log collection in Flow mode.
We’ve improved the detection of rolled log files for loki.source.kubernetes and loki.source.podlogs. We’ve also enabled clustering for these two experimental components, allowing for a simpler and more scalable log collection experience directly via the Kubernetes API.
Furthermore, we’ve improved the Write-Ahead Log (WAL) implementation in the loki.write component to add support for replaying unsent data in case of crashes or restarts and enabled WAL compression.
Scalable Flow graphs
Finally, our latest release improves large-scale deployments of Grafana Agent Flow by improving the resilience of graph evaluation in the presence of slow components.
Having a slow service discovery endpoint or periodic timeouts of multiple scrape targets will no longer affect other pipelines running in parallel.
Learn more about Grafana Agent
That’s all for this release! From the Grafana Agent team at Grafana Labs, best of wishes for the holiday season, and stay tuned for more news!
To learn more about other features in the latest release, please refer to our Grafana Agent documentation or check out our Grafana Agent upgrade guide.
As always, we’d love to hear from you, so feel free to drop by our Grafana Labs Community Slack or check out the Grafana Agent repo directly. We look forward to your comments and feedback!
If you’re not already using Grafana Cloud — the easiest way to get started with observability — sign up now for a free 14-day trial of Grafana Cloud Pro, with unlimited metrics, logs, traces, and users, long-term retention, and access to all Enterprise plugins.