
The Grafana OpenTelemetry Distribution for .NET: Optimized for Application Observability
The OpenTelemetry project provides many different components and instrumentations that support different languages and telemetry signals. However, new users often find it hard to pick the right ones and configure them properly for their specific use cases. For this reason, OpenTelemetry defines the concept of a distribution, which is a tailored and customized version of OpenTelemetry components.
Here at Grafana Labs, we are all-in on OpenTelemetry. That’s why we are excited to announce the public preview of the Grafana OpenTelemetry distributions for Java and .NET. And while these are the first of our OTel distros, they won’t be the last, as we plan to expand our focus to ensure other languages have a great instrumentation experience, too.
In this blog, we’ll focus on our Grafana OpenTelemetry Distribution for .NET. We’ll talk about its benefits and our commitment to upstream, and we’ll show you how to get started today. So let’s dive in!
Note: If Java is your preferred language, check out our companion piece with specific guidance for getting started with the Grafana OpenTelemetry Distribution for Java.
Why use the Grafana OpenTelemetry distributions?
Our Grafana OpenTelemetry distributions can be used with any OpenTelemetry compatible databases and have been optimized for Grafana Cloud Application Observability, our solution for monitoring applications and minimizing mean time to repair (MTTR). They require only minimal setup and configuration and make it very easy to emit telemetry data from your application.
Our distributions:
- Bundle useful instrumentations
- Populate resource attributes and telemetry required for Application Observability
- Allow you to quickly drop telemetry that is not used by Grafana Cloud, thus saving on observability costs
These capabilities allow for a seamless experience while also helping to reduce costs. Furthermore, we test our releases against Grafana Cloud Application Observability to make sure every release is stable and predictable.
We enable getting started quickly by sending telemetry directly to Grafana Cloud, bypassing the setup of a Grafana Agent or an OpenTelemetry Collector. However, for production uses, we recommend running Grafana Agent or an OpenTelemetry Collector for reliability.
How to get started with the Grafana OpenTelemetry Distribution for .NET
You can easily get started with our .NET distribution with minimal or no changes to the applications.
Step 1: Install package
To install the distribution with the full set of dependencies, add a reference to the Grafana.OpenTelemetry NuGet package to the project:
dotnet add package --prerelease Grafana.OpenTelemetry
Step 2: Enable the Grafana distribution at application startup
The UseGrafana extension method on the TracerProviderBuilder, the MetricProviderBuilder or the OpenTelemetryLoggerOptions can be used to set up the Grafana distribution. By default, telemetry data will be sent to Grafana Agent or an OTel collector that runs locally and listens to default OpenTelemetry Protocol (OTLP) ports.
using OpenTelemetry;
using OpenTelemetry.Trace;
using Grafana.OpenTelemetry;

public class Program
{
    public static void Main(string[] args)
    {
        using var tracerProvider = Sdk.CreateTracerProviderBuilder()
            .UseGrafana()
            .Build();
    }
}
Given the zone, instance ID, and API token, telemetry data can be sent directly to the Grafana Cloud without involving an agent or collector. Follow the steps and set the environment variables described below to send data directly to Grafana Cloud.
- Click Details in the Grafana section on https://grafana.com/profile/org.
- Copy Instance ID and the last part of Zone into the command below (e.g. prod-eu-west-0 from EU Belgium - gcp europe-west1 - eu - prod-eu-west-0).
- On the left menu, click on Security and then on API Keys.
- Click on Create API Key (
MetricsPublisherrole) and copy the key into the command below. - Reasonable default settings for service name, namespace, version, instance id, and deployment environment are set. Follow these steps if you want to customize those settings.export GRAFANA_CLOUD_INSTANCE_ID= export GRAFANA_CLOUD_ZONE= export GRAFANA_CLOUD_API_KEY=
Finally, make a few requests to the service to make sure it sends data to Grafana Cloud. It might take up to a minute for data to appear.
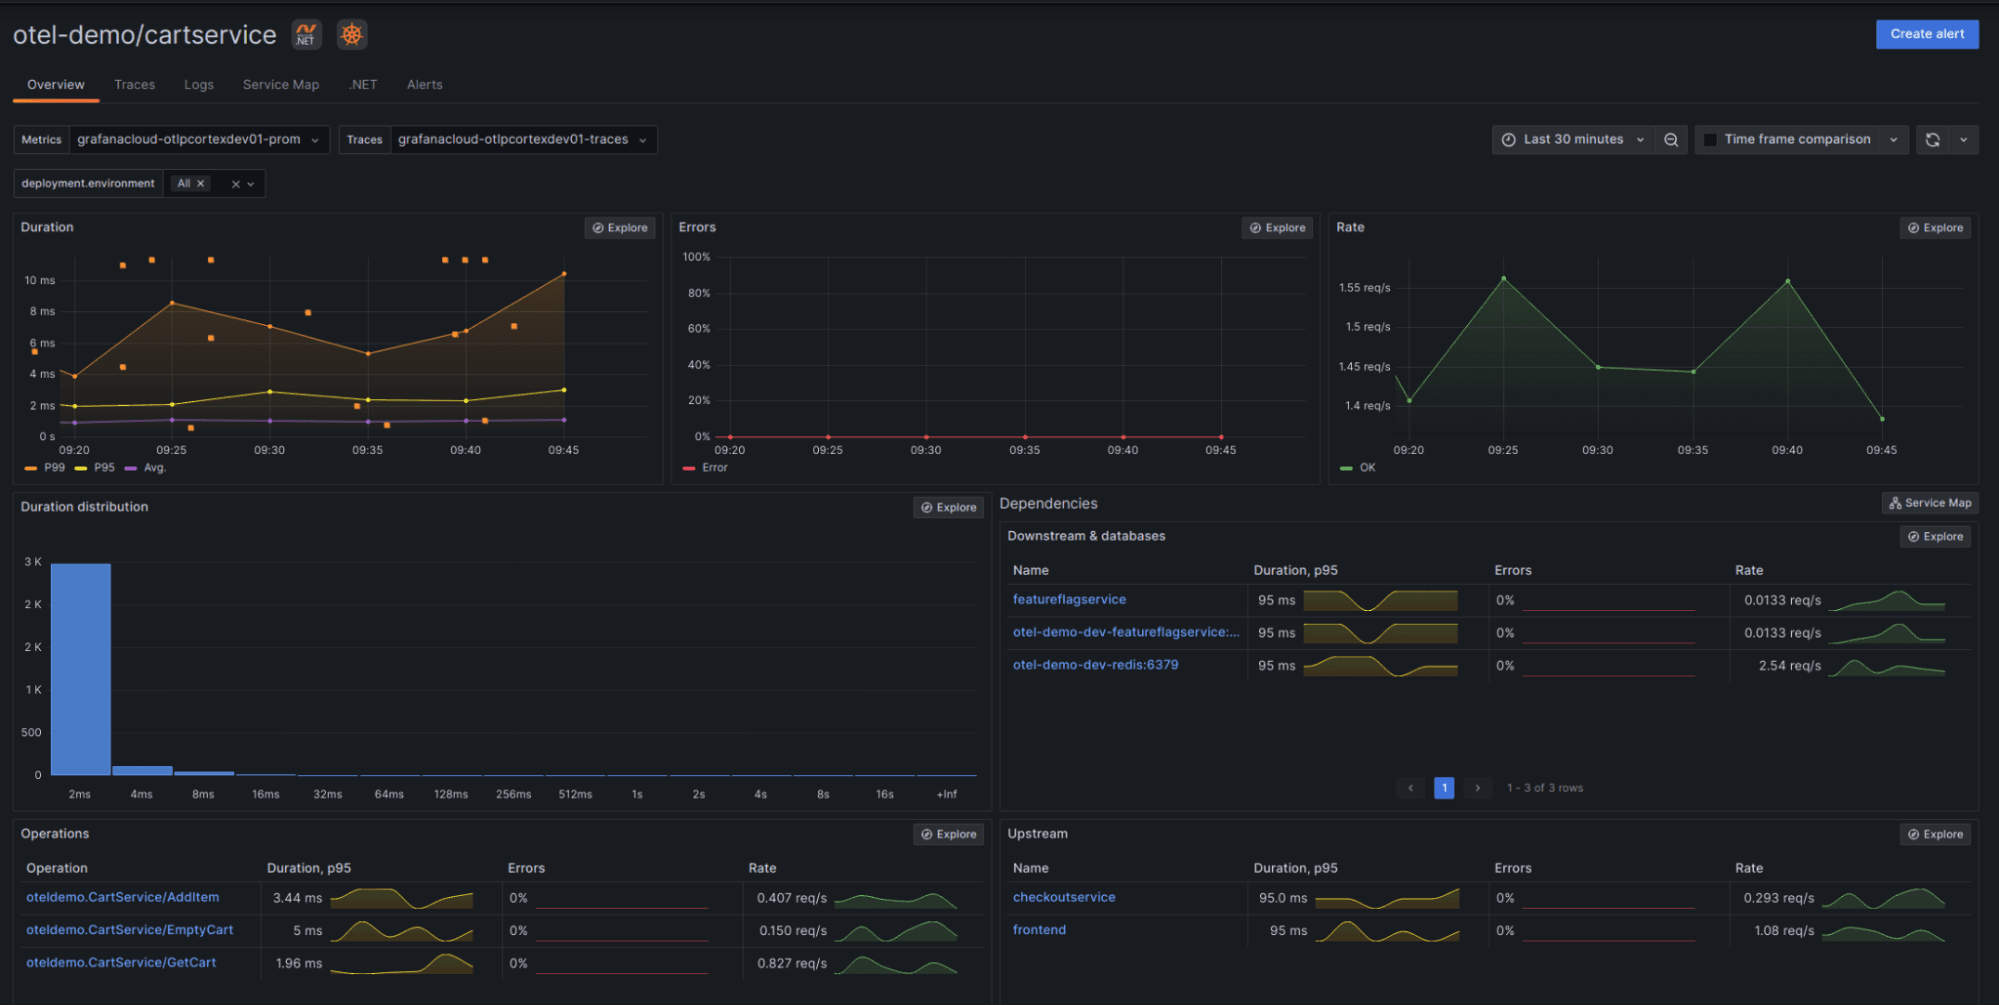
Step 3: Observe the service in Application Observability in Grafana Cloud
In Grafana, replace the path of the URL with /a/grafana-app-observability-app/servicesor:
- Click on the menu icon in the top left corner
- Open the Observability menu
- Click on Application
For detailed installation instructions and the troubleshooting guide, refer to the project README.
Committed to upstream OpenTelemetry
While we are launching these Grafana distributions, we are committed to the upstream OpenTelemetry project. Our distributions serve as lightweight wrappers over the upstream OpenTelemetry instrumentation and they can be easily integrated with Grafana Cloud Application Observability. This means you can start with the Grafana distribution, but migrate to upstream OpenTelemetry instrumentations easily if you choose. This allows you to use the OpenTelemetry APIs, as well as the same knowledge and skills, if you switch to upstream offerings.
Conversely, you can use our distributions with any OpenTelemetry compatible databases and vendors, including Grafana OSS and Grafana Enterprise.
Finally, our aim is to invest in new features upstream before pulling them into our distributions. Recently, we contributed metrics support for HttpClient on .NET Framework and metrics support for OWIN. This benefits the wider community and ensures that all our products work well with the upstream SDKs and not just the Grafana distributions.
What’s next?
The OpenTelemetry project provides an excellent instrumentation ecosystem for .NET users, and we have many ideas of how to make all this goodness easily available for Grafana Cloud users. Besides improving and enhancing the existing functionality of the distribution, we are focusing on three main areas.
First and foremost, we’re looking forward to new releases of upstream components, which will contain support for .NET 8 as well as support for stable HTTP semantic conventions. We will bundle those components in our distributions as soon as releases are available and we have tested them.
We’re also actively working on integrating support for auto-instrumentation into our distribution. We currently enable users to emit telemetry with minimal code changes; however, we strive to provide an out-of-the-box experience for Grafana Cloud users who want to emit telemetry from .NET applications with zero code changes.
Finally, we are extending our test and validation procedures with a focus on stability and backwards-compatibility for Grafana Cloud Application Observability users. No matter whether they’re using .NET Framework or AOT (Ahead-of-Time) compilation, we want our users to be able to utilize the latest upstream features with confidence and avoid unwanted disruptions to their existing observability workflows.
Tell us what you think
Chat with us on our community Slack channel. To invite yourself to the Grafana Slack, visit https://slack.grafana.com and join the #application-observability channel.
You can also ask questions or file issues for bugs, enhancements, and feature suggestions on the project pages for Java and .NET.
Grafana Cloud is the easiest way to get started with metrics, logs, traces, and dashboards. We have a generous forever-free tier and plans for every use case. Sign up for free now!

