

Set and scale service level objectives in Grafana Cloud: Introducing Grafana SLO
When we began offering Grafana Cloud Metrics, we set a service level agreement (SLA) for 99.5% of requests to be completed within a few seconds. So we built an alert that would go off if more than 0.5% of requests were slower than a couple of seconds within a five-minute moving window. Sounds reasonable, right?
Not exactly. The alert fired multiple times a week or sometimes even multiple times a day – typically false alarms. The team went back to the drawing board and refined that SLA alert. The result? The same latency alert that went off almost daily now only triggered once every few weeks. Soon every other team at Grafana Labs was copy-pasting the same alert rules and implementing them for their service. “It’s just been so transformational for the culture of how we measure our performance at Grafana Labs," says CTO Tom Wilkie.
It’s also heavily influenced our product development, which is why at ObservabilityCON 2023 we were excited to announce the general availability of Grafana SLO, a solution in Grafana Cloud that makes it easy to create, manage, and scale service level objectives, SLO dashboards, and error budget alerts. (Read: You don’t have to fumble through reconfiguring alerts like we did!)
Grafana SLO “allows you to build, easily configure, report on, and defend these sophisticated error budget SLOs,” Wilkie said during the ObservabilityCON 2023 opening keynote. “It’s something I’m really proud of, and it’s the only way you should be alerting in my opinion.”
Why SLOs matter
Service level objectives act as a bridge between development and operations teams and help align them towards a common goal — ensuring that your services meet the expectations of users and customers.
Grafana SLO helps you set service level objectives with a guided UI and makes it easy to get started managing your SLOs with prebuilt dashboards, alerts, and recording rules. All of these turnkey tools make prioritizing your incident response less cumbersome for your teams and help to:
1. Reduce alert fatigue
Instead of relying on threshold-based alerts that trigger when something goes wrong, potentially leading to noisy false positives, SLOs are designed to generate alerts preemptively by monitoring key indicators and setting alerts for user-defined error budgets, as well as fast- or slow-burn thresholds.
2. Improve reliability
When you set SLOs, you create a clear understanding of what your users should expect. With Grafana SLO, you can confidently maintain and even improve your service’s reliability, ensuring you meet or exceed those expectations.
3. Enhance data-driven decision making
Grafana SLO provides you with actionable data, allowing you to make informed decisions about how to allocate resources and prioritize improvements that directly impact your users.
Set service level objectives with a simple, guided UI
You don’t have to be an expert to set and manage service level objectives in Grafana SLO. The user-friendly UI streamlines the process of setting your service level objectives so you can easily:
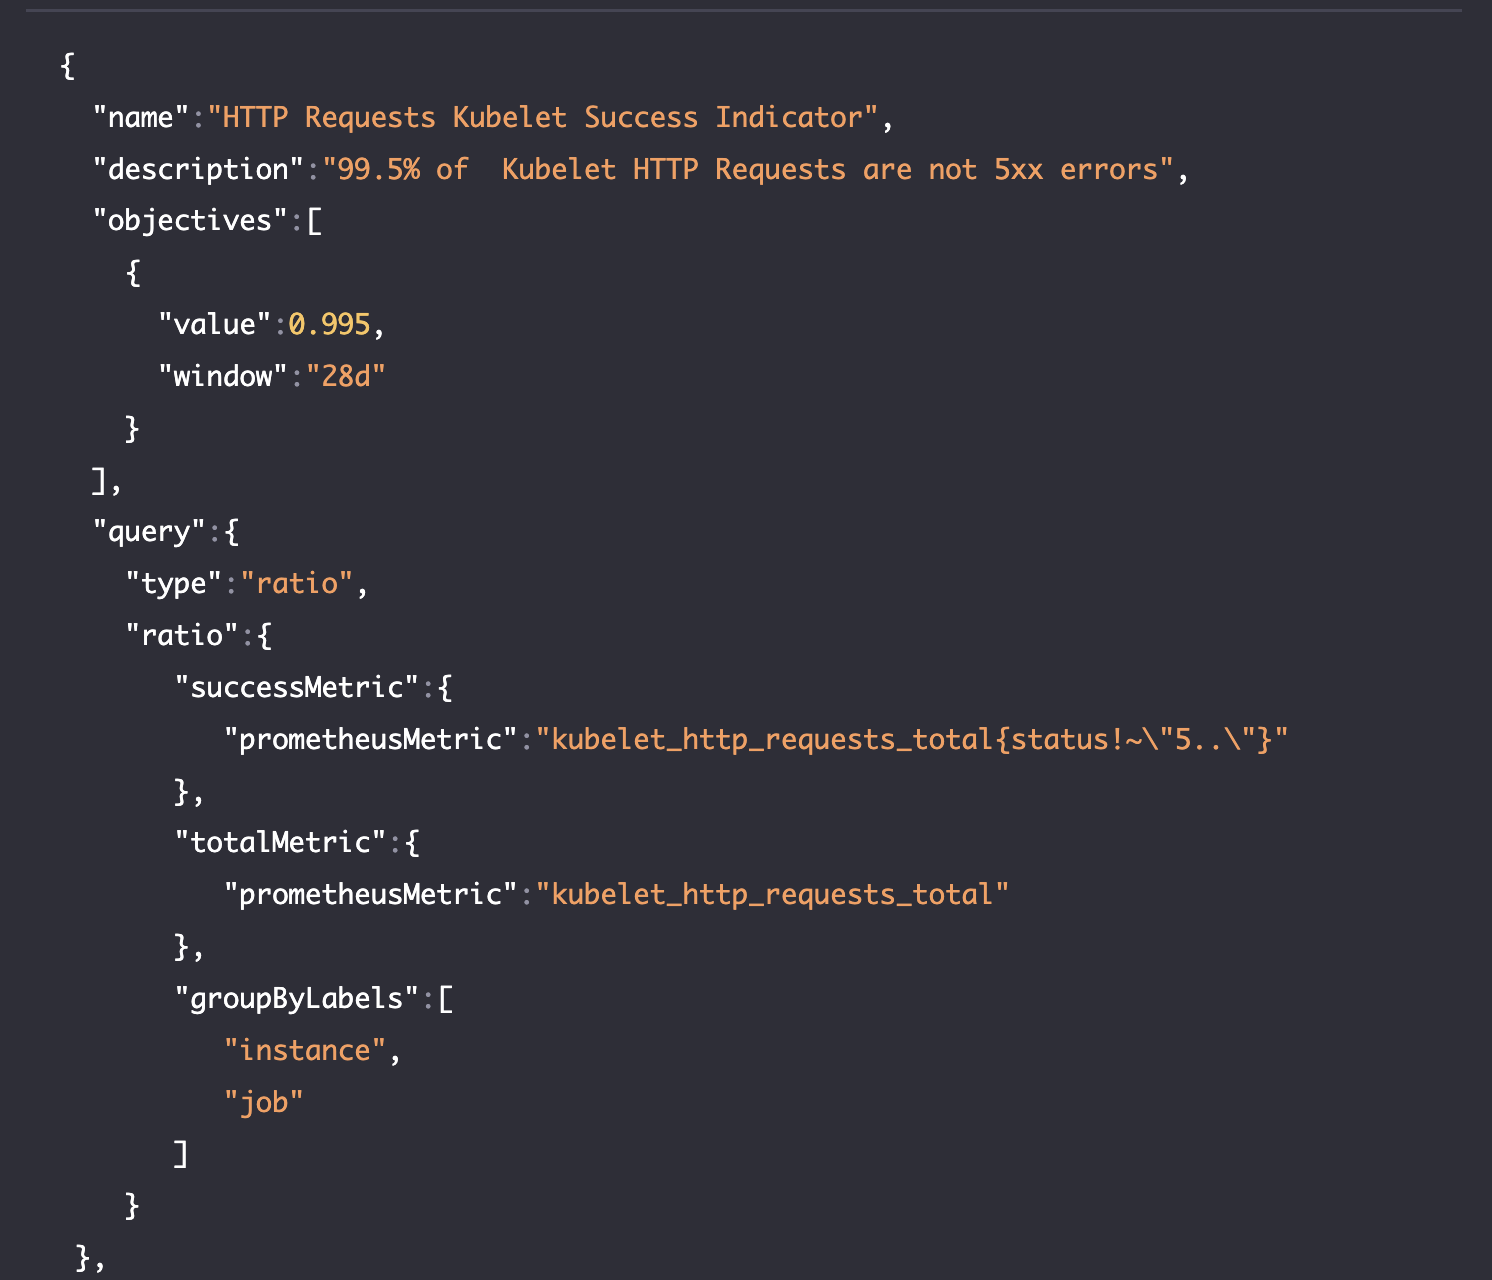
- Define your SLI (service level indicator). Enter your time window and select your success metrics for the service you intend to measure with your SLO. This could be your website, a critical microservice, or any other component.
- Define objectives. Set clear, quantifiable target and error budget thresholds for your service. For example, you might decide that your application’s uptime should be 99.9% or that requests should be served within 500 milliseconds.
- Organize your SLOs. Configure your SLO name, description, and labels, which is key for staying organized so the right team can easily keep track of the right SLO.
- Customize alerting rules. Configure fast-burn and slow-burn alerts that will trigger when your SLOs are at risk. This ensures that you are proactively informed of potential issues and enables you to act swiftly.

Scale SLOs as code
As services and organizations scale, so too must your service level objectives. Grafana SLO allows engineers to scale SLOs as code, making it simple to manage your objectives alongside your evolving infrastructure. There are two methods available to configure SLOs as code:
Terraform integration
Grafana SLO works seamlessly with Terraform. This allows you to automatically modify SLOs as your infrastructure changes, keeping your objectives in sync with your service landscape.
SLO API
Simply create a Grafana API Key with Editor permissions, and then by using any HTTP client such as curl or HTTPie, users can make calls to the plugin’s “resource” API.
Executive-level visibility into service health
The benefits of SLO management extend beyond engineering teams. Business leaders and stakeholders require a high-level view of service reliability to make strategic decisions. Grafana Cloud provides a comprehensive overview of the state of your team’s services, helping you answer key questions about business impact, such as custom satisfaction, revenue, and brand perception.
There are real-time, customizable dashboards that give decision-makers real-time insights into the performance of critical services. Grafana Cloud also offers reporting capabilities that make it easy to compile historical data, which can then directly influence future decisions about resource allocation, risk management, and risk planning.

Learn more about how to manage SLOs in Grafana Cloud
Incorporating SLO management into your operations allows you to not only meet your service reliability goals, but also greatly reduce on-call loads for your engineering teams. With Grafana SLO makes it easy to create and maintain the service level objectives that help you achieve just that. And the interest and demand for SLOs continues to increase: According to Grafana Labs’ 2023 Observability Survey, more than half of respondents say they are using SLOs or moving in that direction.
To watch a deep-dive demo of Grafana SLO, watch the ObservabilityCON 2023 session “Prioritize critical resources with SLO-driven IRM,” now available on demand. You can also check out our Grafana SLO documentation or check out the upcoming webinar “How to set SLOs in Grafana Cloud to prioritize incidents and ensure reliability.”
Grafana Cloud is the easiest way to get started with metrics, logs, traces, and dashboards. We have a generous forever-free tier and plans for every use case. Sign up for free now!


