Manage log volumes, metrics cardinality, monthly bills: Explore Grafana Cloud cost management tools
As more organizations adopt observability at massive scale, they have also been grappling with rising costs. Over the past 12 months, we have been working on different solutions to help our users better understand and manage their observability stack, not to mention the bills that come with scaling it.
At ObservabilityCON 2023, we rolled out a new cost management hub in Grafana Cloud that is home to a suite of new and improved cost management tools developed to help manage, control, and optimize your spend.
Grafana Cloud users with Administrator roles now have access to:
- Log Volume Explorer (public preview) for investigating the source of high log volumes.
- Adaptive Metrics (generally available) for aggregating unused or partially used metrics into lower cardinality versions.
- Usage Attribution Report (public preview) for analyzing monthly metrics usage by teams.
The new cost management hub in Grafana Cloud also includes Usage groups, which attribute metrics usage to teams; and much more.
Here, we’ll walk through some of the latest cost management features available in Grafana Cloud. For a full demo of these features and how the cost management hub works, watch the ObservabilityCON session “Manage rising metrics and logging costs with Grafana Cloud” on demand.
Identify the source of high log volumes
When users are faced with unexpected or unidentified logging costs in their bills, the questions that are top of mind often include:
- Which team is responsible for most of my logs?
- Are there opportunities to trim unnecessary logs?
- What is the reason for a recent spike in my log ingest?
- Did a new project result in a lot of new logs?
Log Volume Explorer, which is currently in public preview across all tiers of Grafana Cloud, was created to answer these questions. It is a point-and-click user interface that helps you dig into estimated log volumes by using any combination of labels associated with those volumes. To get started with this feature, go to Administration > Cost Management > Logs cost management > Log Volume Explorer in Grafana Cloud.
So how does it work? Suppose you want to see which team is responsible for most of your log volume over the last week. You know each team in your organization uses a service_name label to identify themselves. Simply select Last 7 days from the time selector, select the service_name label from the dropdown, click Submit, and boom:
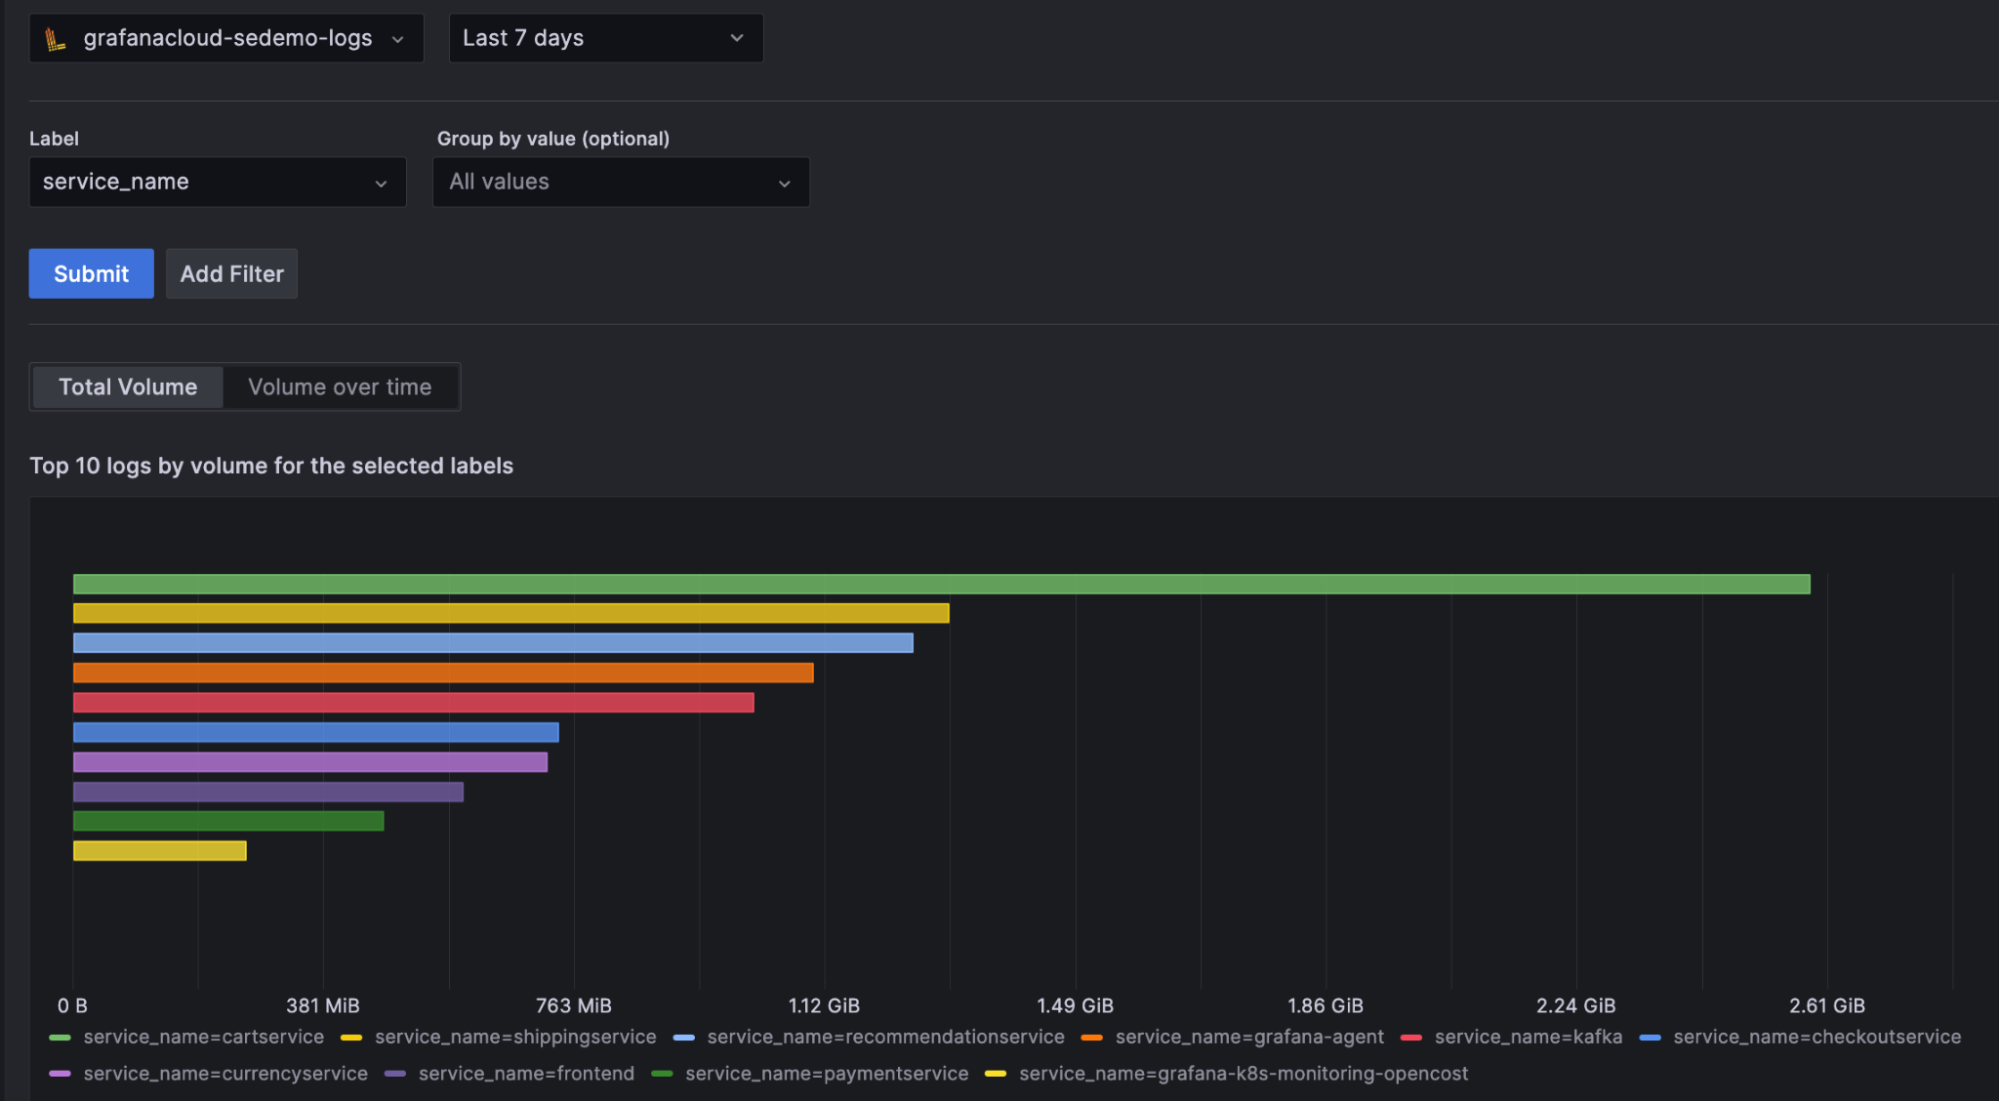
Now you can see that in the past seven days cartservice is responsible for about 2GB — and is by far the largest sender of logs.
Log Volume Explorer allows you to filter your search for specific label values as well as mix and match labels. You can also view your data as a time series to help figure out when a spike or drop in log volumes occurred.
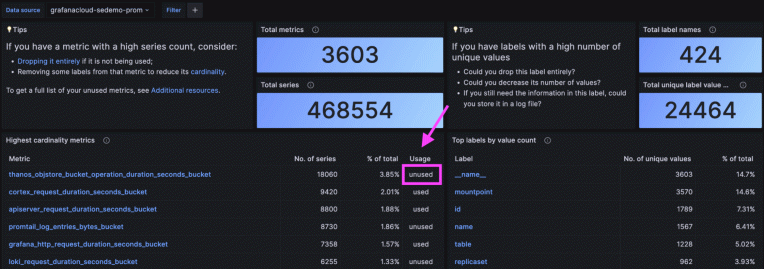
In cases where you aren’t even sure where to begin with analyzing your logs, the Overview tab provides a list of the highest volume log labels in your environment.
Combined with other tools in Grafana Cloud, such as billing alerts, the billing dashboard, and for more precise attribution, recording rules, Log Volume Explorer is a powerful tool that helps you stay in control of your logging costs.
As of today, this public preview feature is available to all Cloud customers, including those in our free-forever tier. If you’re using Grafana Cloud Advanced, please get in touch with your customer success manager. If you’re using Grafana Cloud Free or Pro, you can reach out to Customer Support.
Learn more in our Log Volume Explorer documentation.
Manage metrics cardinality in one click
In a recent analysis of our user environments, we saw that roughly 20% to 50% of metrics generated are never used, but users are still stuck paying for them.
Our solution to the problem is Adaptive Metrics — a metrics management and cardinality optimization feature in Grafana Cloud that eliminates unused and partially used metrics through aggregation.
Adaptive Metrics provides “recommended rules” for metrics that you can aggregate away into lower cardinality versions of themselves. These recommendations update daily, adapting to your metrics usage.
You can then manage these rules directly in the UI, applying and removing them as you see fit without worrying about interrupting your Grafana Cloud operations or your developers’ workflows. After applying the recommendations by using the Apply all recommendations button or applying individual rules ad hoc, you can immediately see the reduction in your total count of time series in the Overview tab.
It’s easy to get started with Adaptive Metrics, which is generally available in all tiers of Grafana Cloud. Simply go to Administration > Cost Management > Metrics cost management > Adaptive Metrics to start managing your metrics cardinality more effectively.
Learn more in our Adaptive Metrics documentation.
Identify billable metrics usage for teams
The Billing/Usage dashboard in Grafana Cloud is a good place to start for understanding your metrics consumption and associated costs. But while the total billable series is available in this dashboard, it’s not possible to drill down to view a more granular breakdown of your metrics usage.
This is where the Usage Attribution Report comes in. This cost management feature, which is in public preview in Grafana Cloud, allows you to understand what teams contribute to your monthly metrics costs. Label values are automatically fetched in the report to show a breakdown of billable series each month. You can then group your billable series based on one or more labels to perform the following:
- Chargeback: A common practice where the bill is split in order to back-charge teams, so each team pays — and is held accountable — for its own consumption.
- Showback: Similar to chargeback, this attributes cost and shares information but without actually charging the teams.
- Financial analysis: Attribute costs based on product line, customer, or region to facilitate cost accounting, budgeting, and forecasting your future costs.
As part of the public preview, we’re also launching the Attribution API to access the Usage Attribution Report. The Attribution API provides the following functionality:
- List what reports are available for a given instance.
- List what reports are available for a given instance within a specified year.
- Get reports from a given instance, which contain a breakdown of the billable usage based on the configured labels. You can retrieve reports for a specified month.
What’s the difference between the Usage Attribution Report and Usage groups in Grafana Cloud?
The Usage Attribution Report provides a monthly breakdown of your billable series using a set of label keys. The Usage Attribution Report is easy to configure and can scale to support thousands of drill-down values, enabling you to see all usage that contributes to your monthly bill.
On the other hand, the Usage groups feature gives you a real-time view of active series based on specific label values you’ve defined. You can see what systems are sending specific metrics to Grafana Cloud for up to 100 different groups.
The Usage Attribution Report feature is currently available in public preview to Grafana Cloud Pro and Advanced Cloud users. Please contact your CSM or Customer Support to get started and configure your Usage Attribution Reports. We welcome your feedback about how this supports your cost management needs and how we can improve it as we progress to general availability.
To learn more about the Usage Attribution Report, take a look at our documentation.
Learn more about cost management in Grafana Cloud
Learn more about cost management in Grafana Cloud by watching the opening keynote from ObservabilityCON 2023. You can also catch the ObservabilityCON session “Manage rising metrics and logging costs with Grafana Cloud” on demand.
If you’re not already using Grafana Cloud — the easiest way to get started with observability — sign up now for a free 14-day trial of Grafana Cloud Pro, with unlimited metrics, logs, traces, and users, long-term retention, and access to all Enterprise plugins.