
Monitor your OpenAI usage with Grafana Cloud
In the ever-changing field of artificial intelligence, OpenAI is consistently seen as a leader in innovation. Its AI models, starting with GPT-3 and now with GPT-4, are already used extensively in software development and content creation, and they’re expected to usher in entire sets of new systems in the future.
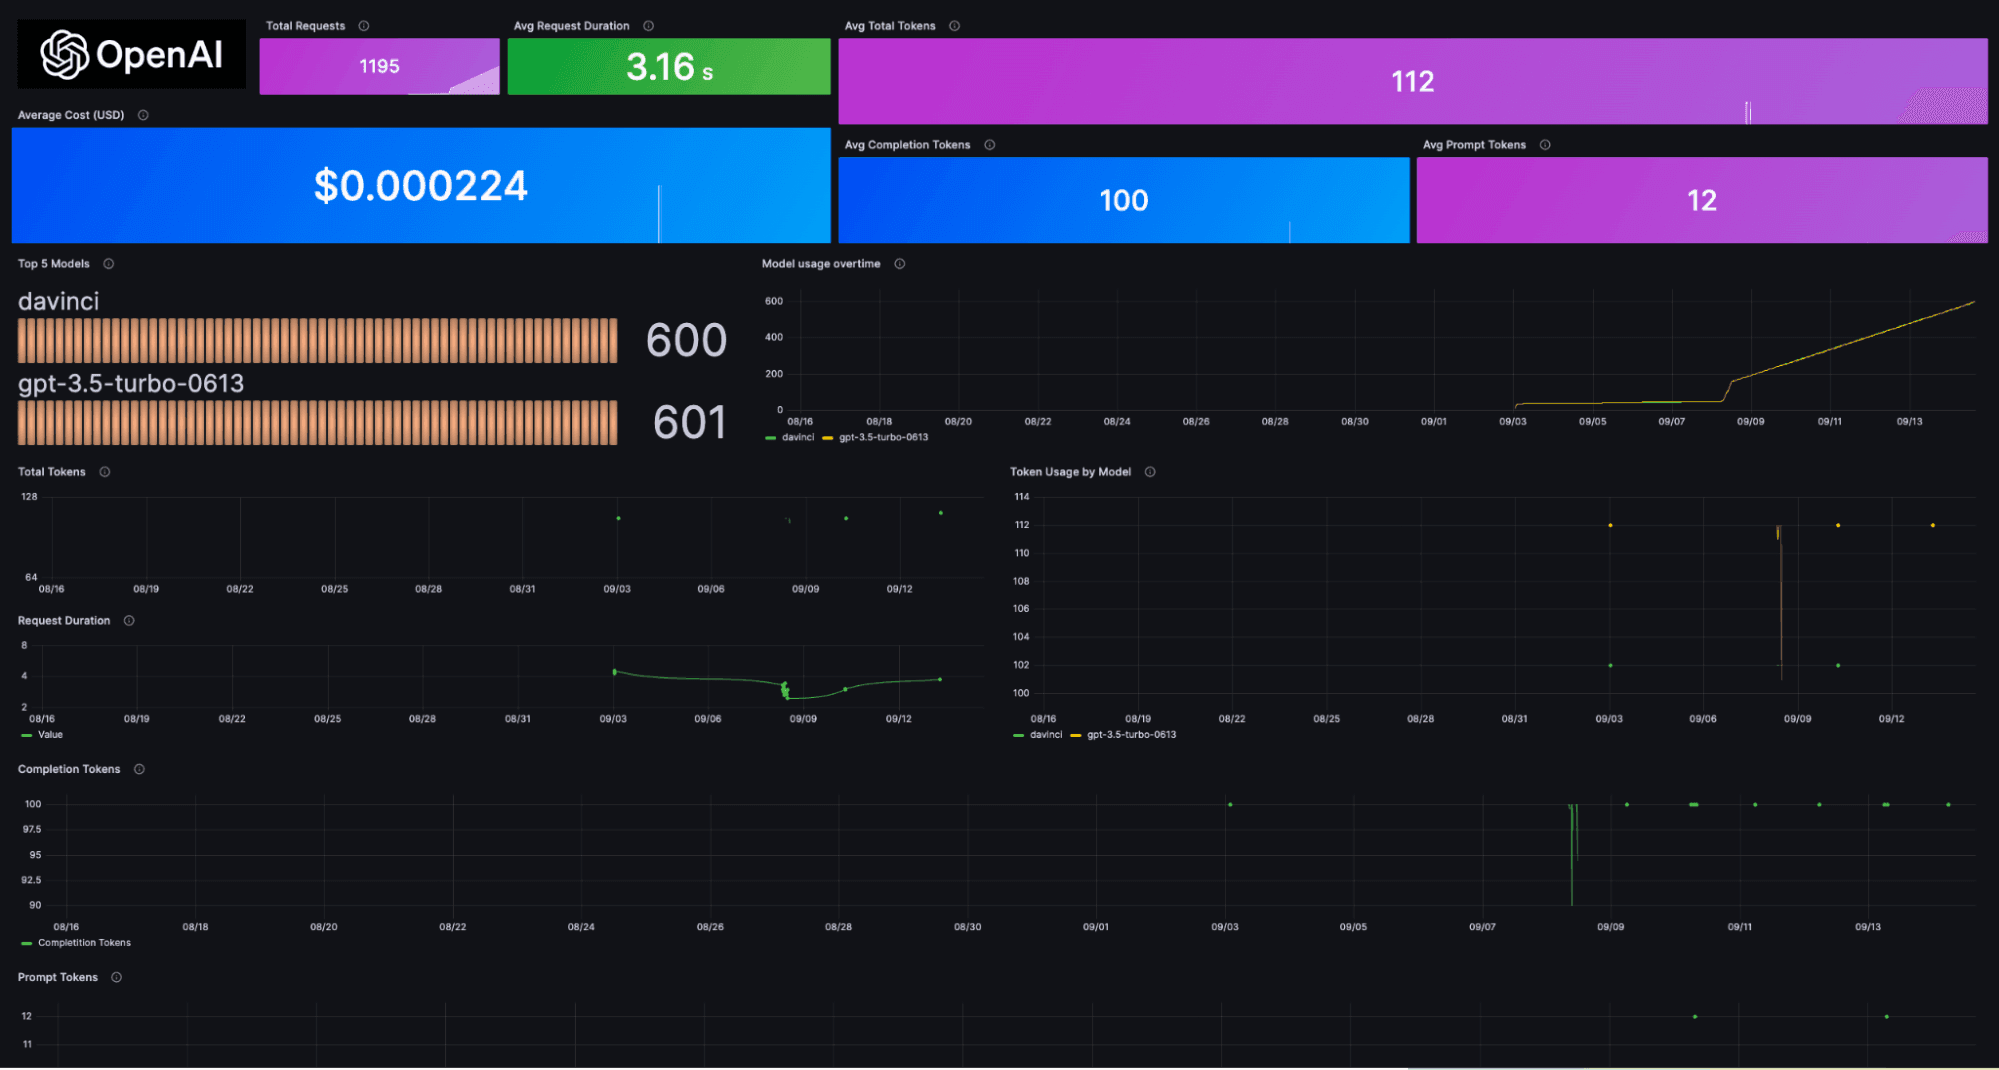
As OpenAI-based applications get more complex, we must have the tools to observe how they work so we can run and fix them as needed. That’s why we’re excited to introduce the Grafana Cloud integration for OpenAI, our solution that can help you control costs, track and optimize resources, and keep tabs on the effectiveness and accuracy of your application’s responses. In this blog, we’ll take a closer look at why you need to monitor OpenAI usage and show you how to easily get started using our prebuilt dashboards to ensure your application is running smoothly.
Why do we need to monitor our OpenAI usage?
There are lots of good reasons to monitor your OpenAI usage. Here are some of the key benefits of doing so:
- Cost control. By monitoring token usage, you can keep track of how many tokens you’re using and manage their costs effectively.
- Resource optimization. Get the most out of your resources by understanding how many completion tokens are used for each request. This helps to efficiently use API quotas and manage resource usage.
- Model selection. Monitoring helps you identify which models are used most frequently. You can use this information to help you choose the most appropriate model for your specific use case, whether it’s GPT-3.5, GPT-4, or others.
- Quality assurance. By keeping track of prompts and responses, you can review and analyze the quality of the interactions with the AI. Identify patterns of successful or unsuccessful interactions and make improvements accordingly.
- Token efficiency. Analyze which prompts and responses consume the most tokens, which can help you design more token-efficient interactions to get the most out of API quotas.
- Performance metrics. Monitor request duration times to get insights into the responsiveness of the API. You can assess whether requests are taking longer than desired and make adjustments as needed.
- Usage trends. Over time, you can identify usage trends, such as peak usage hours or specific patterns in requests. This can be valuable for capacity planning and ensuring that the service meets user demand.
How to monitor OpenAI usage with Grafana Cloud
There are lots of potential use cases for monitoring OpenAI, but for the purposes of this blog, let’s focus on one example. Imagine a support chatbot powered by OpenAI, effortlessly addressing customer inquiries on your behalf. For optimal utilization of OpenAI models, it’s crucial that you gain insights into costs, token usage, and performance. The Grafana OpenAI solution delivers those valuable insights and equips you with the tools to maximize your chatbot’s effectiveness.
And now that we’ve discussed why you need to monitor your OpenAI usage, let’s dig into how you can use Grafana Cloud to do it.
Track request costs based on token usage
- Token consumption breakdown. Get a detailed breakdown of token consumption for every API request made by your chatbot. Granular consumption data is provided automatically through the prebuilt dashboard.
- Cost attribution and optimization. When you track token consumption, you can attribute costs to individual interactions, helping you pinpoint which conversations are driving up your operational expenses and optimize for cost efficiency. This ensures that you get the most value out of your API quotas without overspending. In the context of our support chatbot, this means you can provide the same level of service while staying within your budget.
Analyze model usage
- Model popularity. Within the Grafana dashboard, you can view a panel that displays the popularity of OpenAI models used in your application. This panel provides insights into which model is being used more frequently. This information provides visibility into the distribution of model usage within your application.
- Model performance. Tracking model usage isn’t just about popularity; it’s also about performance. Evaluating the performance of different models helps you make data-driven decisions. For example, you can identify that a
GPT-4model excels at handling technical queries. Armed with this knowledge, you can assign it to handle such inquiries, ensuring accurate and efficient responses.
Analyze response times
- Response time metrics. The Grafana OpenAI dashboard equips you to monitor and analyze response times for API requests. In the world of customer support, response times are critical. The dashboard provides metrics related to response times for API requests, which you can use to ensure your chatbot meets desired performance standards. If there are delays, you can take corrective actions to optimize performance and deliver a smooth experience to users.
Track user engagement
- Model attribution. Identify the model used for each interaction. This information aids in understanding which models excel in specific user queries or tasks, enabling you to make informed decisions about model selection.
- Token usage visibility. The panel also provides insights into the token usage associated with each interaction. This granularity allows you to analyze which prompts and responses consume the most tokens, helping you design more token-efficient interactions to optimize API quotas.
- Quality assurance. Quality and effectiveness are paramount. With the dashboard, review and analyze prompts and responses exchanged between users and your support chatbot, facilitating ongoing improvements for a better user experience.

Prebuilt alerts
Within the Grafana OpenAI solution, you get prebuilt alerts designed to address specific usage scenarios and keep your OpenAI-dependent applications running smoothly. These alerts serve as a proactive monitoring mechanism so you stay ahead of potential issues and ensure optimal performance. Here’s an in-depth look at each of these prebuilt alerts:
- HighCompletionTokensUsage
Description: This alert will trigger if the sum of openai_completionTokens exceeds 10,000 over a five-minute window.
Severity: Critical
Use Case: Critical situations where excessive completion token consumption is detected are flagged, allowing for immediate action to optimize token usage and manage costs effectively.
- HighPromptTokensUsage
Description: This alert will trigger if the sum of openai_promptTokens exceeds 5,000 over a five-minute window.
Severity: Warning
Use Case: It serves as a warning for elevated prompt token usage, highlighting scenarios where adjustments to prompt design or token-efficient interactions might be necessary.
- HighTotalTokensUsage
Description: This alert will trigger if the sum of openai_totalTokens exceeds 15,000 over a five-minute window.
Severity: Critical
Use Case: It addresses critical situations where the total token consumption reaches a potentially unsustainable level, prompting immediate attention to manage and optimize token usage.
- LongRequestDuration
Description: This alert will trigger if the maximum request duration for any model exceeds two seconds over a two-minute window.
Severity: Warning
Use Case: It serves as a warning for unusually long request durations, indicating potential performance bottlenecks that require investigation and optimization.
- HighUsageCost:
Description: This alert will trigger if the sum of openai_usageCost exceeds 100 over a five-minute window.
Severity: Critical
Use Case: It is designed to address critical cost-related issues, ensuring that your AI-powered systems are not incurring unexpectedly high expenses.
Getting started with the OpenAI Integration in Grafana Cloud
NOTE: The OpenAI integration would not work in regions where the Influx Telegraf is not supported in Grafana Cloud. The Grafana OpenAI Integration currently supports Python, with support for other languages planned for the future.
To get started with the Grafana OpenAI integration, follow these steps:
- Log in to your Grafana instance (If you aren’t already using Grafana Cloud, sign up for a forever-free account today.)
- Once logged in, navigate to the “Connections” page
- In the Connections page, Search for “OpenAI”
- Within the OpenAI integration, follow the steps on the “Configuration Details” page
Once you’ve handled everything in Grafana Cloud, you’ll need to take a few more actions, though it doesn’t necessarily need to be done within your Grafana instance.
For starters, you’ll want to install grafana-openai-monitoring, a Python library that provides a decorator to monitor Chat completions and Completions endpoints of the OpenAI API. It facilitates sending metrics and logs to Grafana Cloud, allowing you to track and analyze OpenAI API usage and responses.
You can install grafana-openai-monitoring using pip:
pip install grafana-openai-monitoring
To monitor Chat completions using the OpenAI API, you can use the chat_v2.monitor decorator. This decorator automatically tracks API calls and sends metrics and logs to the specified Grafana Cloud endpoints.
Here’s how to set it up:
import openai
from grafana_openai_monitoring import chat_v2

# Set your OpenAI API key
openai.api_key = "YOUR_OPENAI_API_KEY"

# Apply the custom decorator to the OpenAI API function
openai.ChatCompletion.create = chat_v2.monitor(
    openai.ChatCompletion.create,
    metrics_url="YOUR_PROMETHEUS_METRICS_URL",  # Example: "https://prometheus.grafana.net/api/prom"
    logs_url="YOUR_LOKI_LOGS_URL",  # Example: "https://logs.example.com/loki/api/v1/push/"
    metrics_username="YOUR_METRICS_USERNAME",  # Example: "123456"
    logs_username="YOUR_LOGS_USERNAME",  # Example: "987654"
    access_token="YOUR_ACCESS_TOKEN"  # Example: "glc_eyasdansdjnaxxxxxxxxxxx"
)

# Now any call to openai.ChatCompletion.create will be automatically tracked
response = openai.ChatCompletion.create(model="gpt-4", max_tokens=100, messages=[{"role": "user", "content": "What is Grafana?"}])
print(response)
To monitor Completions using the OpenAI API, you can use the chat_v1.monitor decorator. This decorator adds monitoring capabilities to the OpenAI API function and sends metrics and logs to the specified Grafana Cloud endpoints.
Here’s how to apply it:
import openai
from grafana_openai_monitoring import chat_v1

# Set your OpenAI API key
openai.api_key = "YOUR_OPENAI_API_KEY"

# Apply the custom decorator to the OpenAI API function
openai.Completion.create = chat_v1.monitor(
    openai.Completion.create,
    metrics_url="YOUR_PROMETHEUS_METRICS_URL",  # Example: "https://prometheus.grafana.net/api/prom"
    logs_url="YOUR_LOKI_LOGS_URL",  # Example: "https://logs.example.com/loki/api/v1/push/"
    metrics_username="YOUR_METRICS_USERNAME",  # Example: "123456"
    logs_username="YOUR_LOGS_USERNAME",  # Example: "987654"
    access_token="YOUR_ACCESS_TOKEN"  # Example: "glc_eyasdansdjnaxxxxxxxxxxx"
)

# Now any call to openai.Completion.create will be automatically tracked
response = openai.Completion.create(model="davinci", max_tokens=100, prompt="Isn't Grafana the best?")
print(response)
To use the grafana-openai-monitoring library effectively, you need to provide the following information:
- YOUR_OPENAI_API_KEY: Replace this with your actual OpenAI API key
- YOUR_PROMETHEUS_METRICS_URL: Replace the URL with your Prometheus URL
- YOUR_LOKI_LOGS_URL: Replace with the URL where you want to send Grafana Loki logs
- YOUR_METRICS_USERNAME: Replace with the username for Prometheus
- YOUR_LOGS_USERNAME: Replace with the username for Loki
- YOUR_ACCESS_TOKEN: Replace with the Cloud Access Policy token required for authentication
After configuring the parameters, the monitored API function will automatically log and track the requests and responses to the specified endpoints.
To install the dashboards, simply click on the Install Dashboards and Alerts button on the OpenAI integration page in your Grafana instance (Grafana Instance > Connections > OpenAI > Configuration Details).
Learn more about the OpenAI integration
The new OpenAI integration for Grafana Cloud makes it easier than ever to monitor your OpenAI usage in just a few simple steps. With the prebuilt dashboard, you will focus only on the metrics that matter most — and easily discover when things aren’t right.
To find out more, head over to our OpenAI integration documentation.
We’re excited to hear what you think and welcome your feedback in the #integrations channel of the Grafana Labs Community Slack!
Take the OpenAI integration for a spin in Grafana Cloud, the easiest way to get started with metrics, logs, traces, and dashboards. For a look at our generous forever-free tier and plans for every use case, sign up now!

