
How to configure OpenTelemetry .NET Automatic Instrumentation with Grafana Cloud
For those who have limited experience with OpenTelemetry, it can be intimidating to instrument .NET applications. But the OpenTelemetry community created a welcome shortcut with the first stable release of .NET Automatic Instrumentation. It simplifies the process of collecting metrics, logs, and traces from your .NET applications, without applying any changes to the source code or adding any dependencies to the OSS project.
Auto-instrumentation for .NET applications is particularly advantageous when you have a vast codebase and manually instrumenting every component is impractical. It’s also helpful when you are looking to just try out OpenTelemetry in your project because the setup requires little effort and has minimal impact on your existing infrastructure.
This post walks you through how to set up OpenTelemetry auto-instrumentation for a .NET 6.0 application running on Linux. We’ll also show you how to send your OpenTelemetry data to Grafana Cloud via Grafana Agent using Flow mode.
Note: For other scenarios, it is recommended to utilize the .NET integration for Grafana Cloud, which walks you through the necessary steps for configuring different operating systems and different versions of .NET. To access the .NET integration, follow these steps to install an integration in Grafana Cloud and select the .NET integration. After selecting your operating system and your .NET version, you will be provided with precise setup instructions.
Set up OpenTelemetry Automatic Instrumentation for .NET applications
Step 1: Set up Grafana Agent
The OpenTelemetry .NET Automatic Instrumentation emits all telemetry data via OTLP (the OpenTelemetry Protocol); therefore, we will set up Grafana Agent in Flow mode to accept incoming OTLP data for metrics, logs, and traces.
If you already have a local endpoint configured that listens to standard OTLP ports and forwards data to Grafana Cloud (either via Grafana Agent or the OpenTelemetry Collector), then you can skip this step.
After installing Grafana Agent in Flow mode according to these instructions, the .NET integration supports creating a respective Grafana Agent configuration. After entering an API token name, a new API token will be generated as well as a Grafana Agent configuration utilizing this API token, which allows sending OTLP data to the Agent.
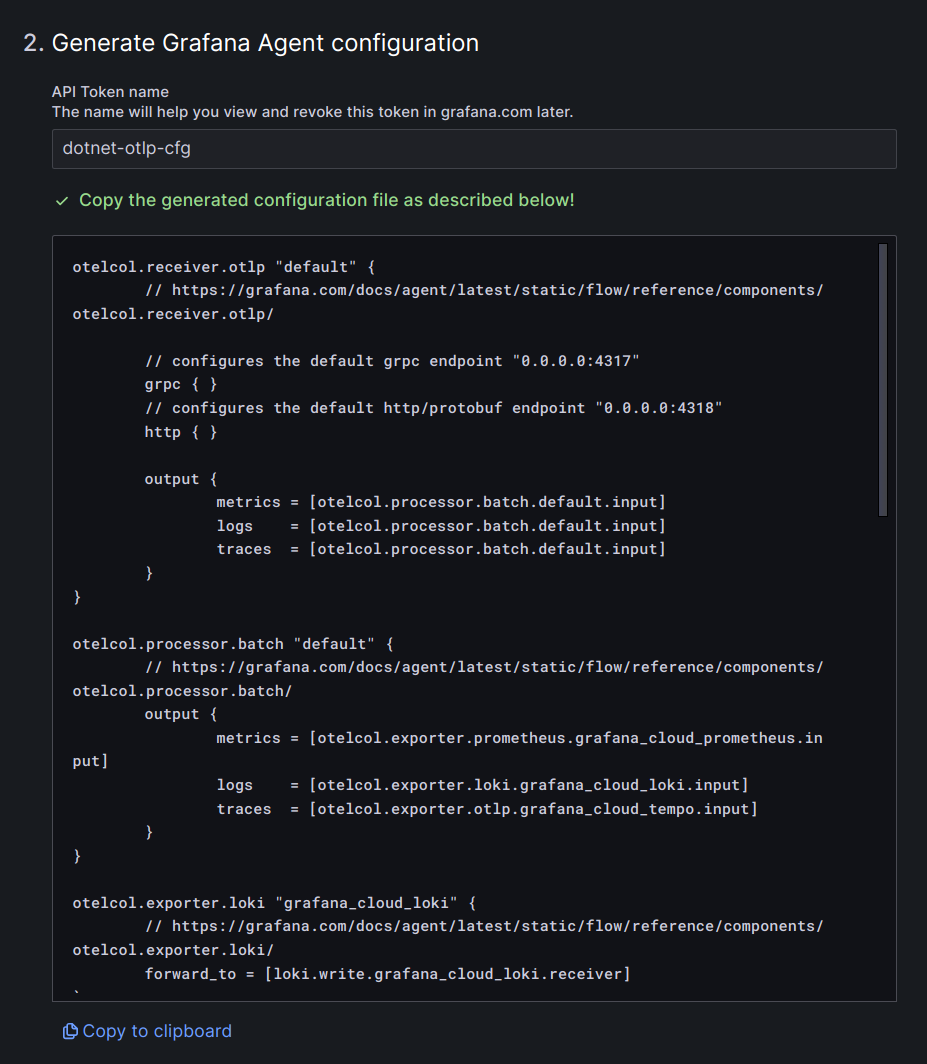
Save the Grafana Agent configuration as /etc/grafana-agent-flow.river and then trigger a configuration reload:
sudo systemctl reload grafana-agent-flowThe provided configuration sets Grafana Agent to listen at the default OTLP ports 4317 (gRPC) and 4318 (HTTP) for metrics, logs, and traces. By default, the .NET automatic instrumentation sends OTLP data to port 4318 via HTTP.
Step 2: Install and invoke the OpenTelemetry automatic instrumentation package
An installation script allows for an easy installation of necessary packages, scripts, and configuration files. After downloading the installation script for the version 1.0.2 of the OpenTelemetry .NET Automatic instrumentation, set the environment variable OTEL_DOTNET_AUTO_HOME to the desired installation folder and invoke the installation script:
wget
https://github.com/open-telemetry/opentelemetry-dotnet-instrumentation/releases/download/v1.0.2/otel-dotnet-auto-install.sh
export OTEL_DOTNET_AUTO_HOME="$HOME/.otel-dotnet-auto"
sh otel-dotnet-auto-install.sh
In addition, we set execute permissions on the instrument.sh script, which will be needed for the next step:
chmod +x $OTEL_DOTNET_AUTO_HOME/instrument.shThe instrument.sh script sets up all environment variables needed to initialize the auto-instrumentation at application startup. The following command assumes that the current working directory is the root directory of an executable .NET package we’d like to run:
$OTEL_DOTNET_AUTO_HOME/instrument.sh dotnet runWhen passing the invocation command of our applications as arguments, the script will start the application in an environment where all necessary variables are set and the auto-instrumentation can be initialized.
No more instrumentation required for .NET applications!
No further instrumentation is necessary, no packages need to be added to the application, and no recompiling needs to be done. The .NET automatic instrumentation uses a combination of startup hooks, profiler hooks, and bytecode manipulation to inject and initialize existing instrumentation libraries.
The auto-instrumentation can be configured and customized via a wide range of environment variables. This allows specifying OTLP endpoints other than the default ones, disabling certain instrumentations, or activating additional log and debug output.
However, the default configuration is sufficient to send data to Grafana Agent based on the setup in the previous steps.
Visualize your .NET application telemetry in Grafana Cloud
After starting our application as described above, we should see metrics showing up in our Grafana Cloud stack. The .NET automatic instrumentation sends a large number of metrics by default, such as process metrics and runtime metrics.
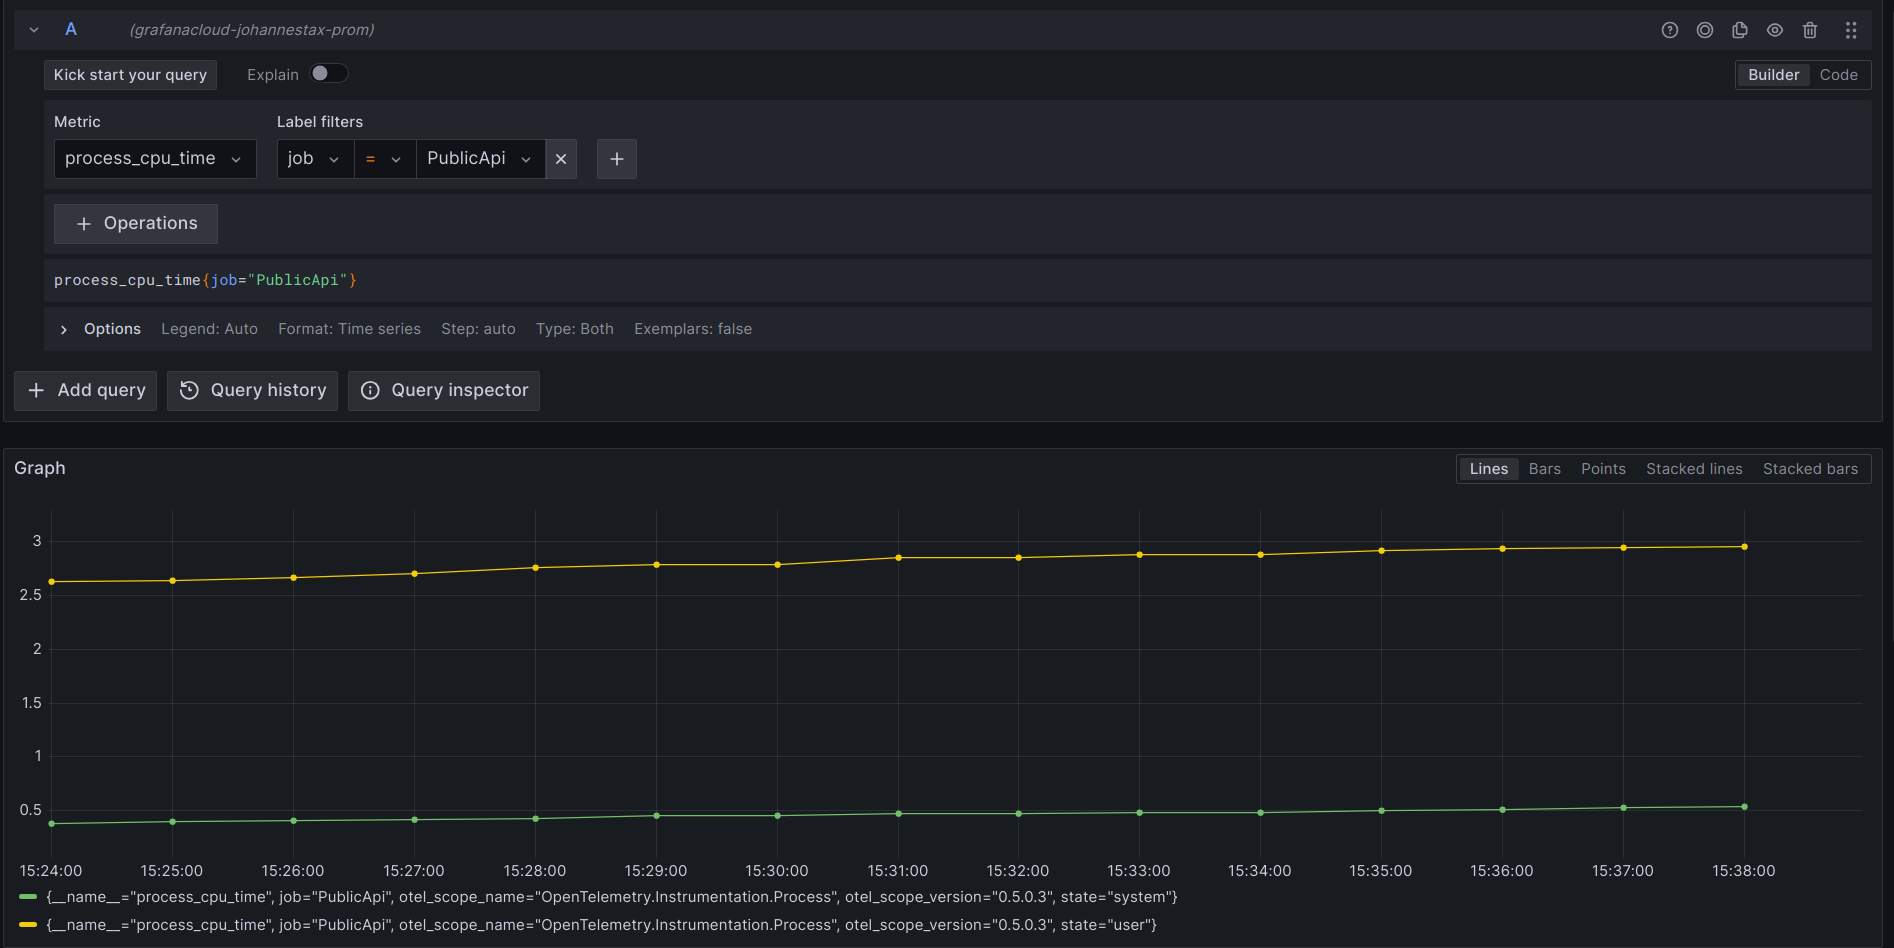
The screenshot above shows the CPU time process metric, but there are also metrics for memory usage, GC heap size, duration of GC collection cycles, thread pool size and utilization, as well as component-specific metrics like HTTP client and server request durations.
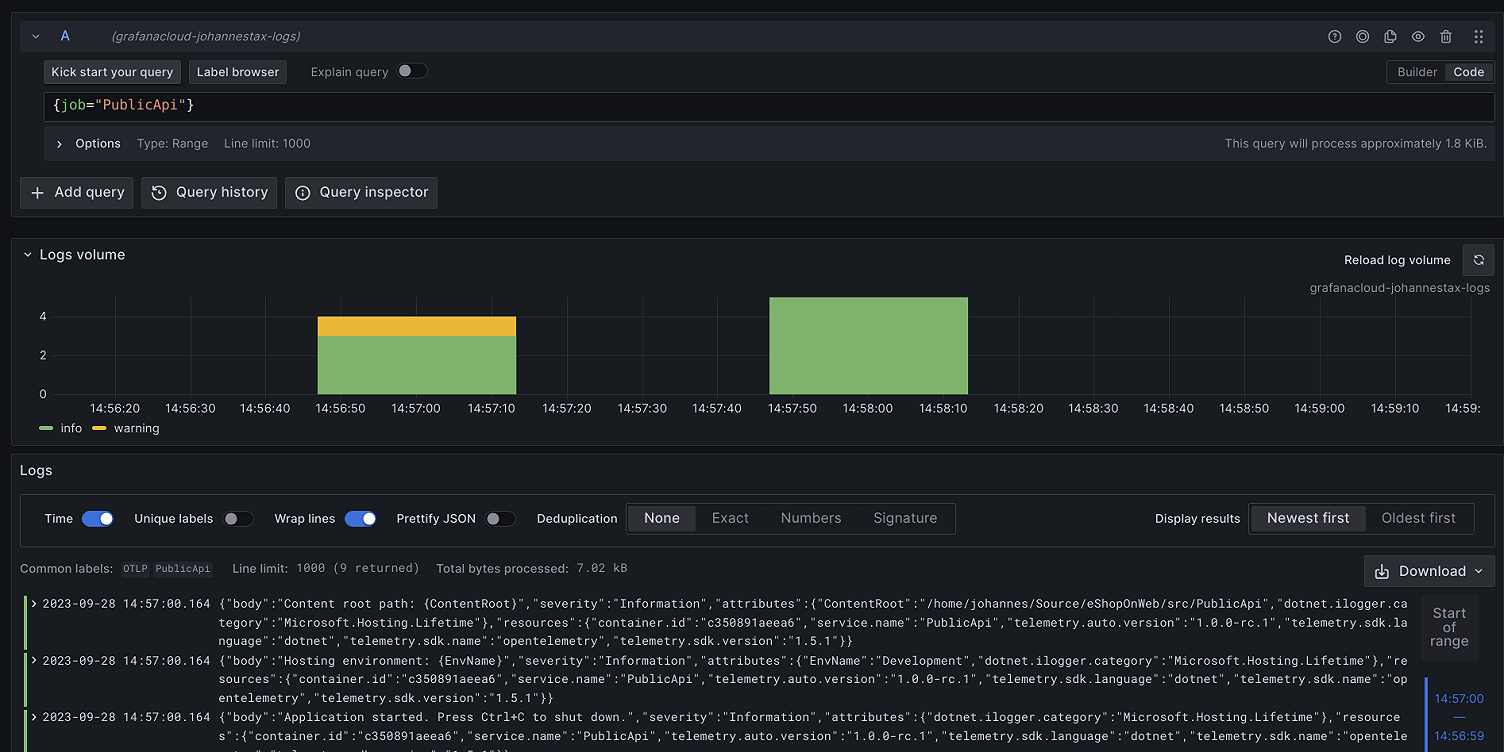
The .NET automatic instrumentation also forwards all log messages that correspond to the configured log level, and we can query all those messages with Grafana Cloud Logs (which is powered by the open source Grafana Loki project):

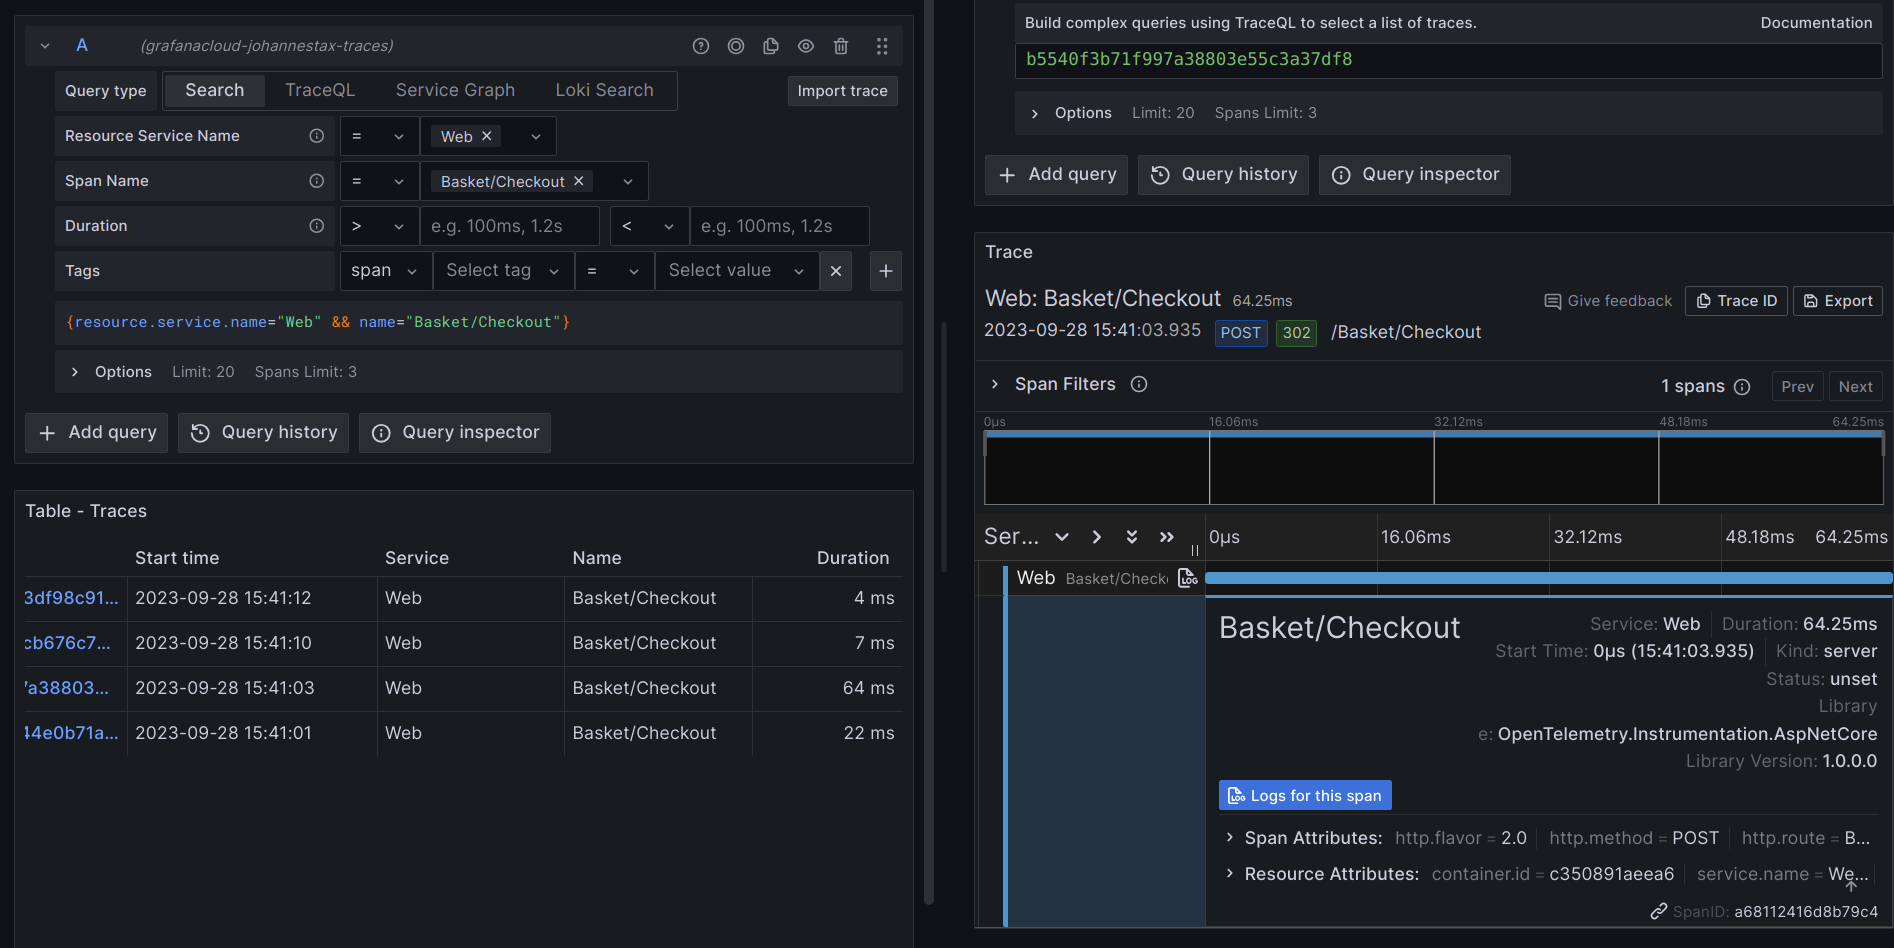
Finally, let’s investigate the traces created by the .NET automatic instrumentation. We can find spans for incoming and outgoing HTTP requests as well as for outgoing database requests using Grafana Cloud Traces (which is powered by the open source Grafana Tempo project):
Learn more about OpenTelemetry automatic instrumentation
Instrumenting applications with OpenTelemetry can be challenging for several reasons:
- You need to become familiar with basic concepts like exporters, provider builders, and instrumentation libraries.
- You need to know how to choose and configure an exporter for the backend you want to use, and how to choose the right instrumentation packages and versions for a given application.
- Enabling and troubleshooting instrumentation requires expensive re-compilation and deployment cycles.
- It’s hard to just “try it out” because configuring OpenTelemetry could easily turn into a task that takes hours (or days).
Auto-instrumentation tries to take the pain out of instrumentation. The steps don’t require any code changes, and you can easily integrate the setup into existing deployment workflows, such as plugging into Grafana Cloud for a complete view into the health and performance of your .NET application.
While some users might prefer the approach of manual instrumentation to have full control and flexibility, OpenTelemetry .NET Automatic Instrumentation provides a great way to emit high-quality telemetry data from your .NET application with minimum investment.
For in-depth technical documentation and advanced use cases, please refer to the official OpenTelemetry .NET Automatic Instrumentation documentation.
Grafana Cloud is the easiest way to get started with metrics, logs, traces, and dashboards. We have a generous forever-free tier and plans for every use case. Sign up for free now!


