
Create a logs app plugin with Grafana Scenes and Grafana Loki
Grafana’s plugin tools help developers extend Grafana’s core functionality and create plugins faster, with a modern build setup and zero configuration. Grafana Scenes, meanwhile, is a new front-end library, introduced with Grafana 10, that enables developers to create dashboard-like experiences — such as querying and transformations, dynamic panel rendering, and time ranges — directly within Grafana application plugins.
In this blog post, we’ll explore how to combine Grafana plugin tools, Grafana Scenes, and Grafana Loki — our horizontally scalable, highly available, multi-tenant open source log aggregation system — to create a logs application plugin to query and visualize logs.
Tools and requirements
Before we begin, you’ll need to have the following tools set up:
- LTS version of Node.js
Once you have all of these things installed, we can create an empty project and set up our local development environment.
Create an empty project
To create our empty project, we start by running npx @grafana/create-plugin@latest if using npm or yarn create @grafana/plugin if using Yarn.
Once the command successfully runs, we’ll need to provide the name of our plugin, the organization name, a description, and the type of plugin. For the type of plugin, select scenesapp.
For this application, select No for the backend option, and complete the rest of the options to your preference.
Next, we need to change the current directory to the project root, install the Node dependencies, and start Docker (docker-compose up -d) and Node (yarn run dev or npm run dev).
Configure a Loki data source
For the sake of simplicity, we’re going to skip setting up and feeding data to a Loki instance, but our documentation can help you get started with Loki and Promtail.
Alternatively, if you’re more interested in building a working app plugin than in the actual data, you can use Grafana’s Docker development environments to quickly get started with a Loki instance with sample data. This set-up process can be as simple as running make devenv sources=loki in your console.
Once we have a running Loki instance, we’re going to add it as a data source to our empty project by navigating to http://localhost:3000 (don’t tell anyone, but the default credentials are admin/admin 🤐). Then:
- Click Connections in the left-side menu
- Select Add new connection
- Select Loki data source
- Select Create Loki data source
Once on the Loki data source configuration page, simply name the data source, enter http://LOKI_HOST_OR_IP:3100 in the URL field (where LOKI_HOST_OR_IP is the IP or hostname of your Loki instance), and click Save and test.
Note:If you’re using Loki inside another Docker container, make sure both Loki and your plugin app containers are connected and visible in the same network.
Compose a scene in Grafana Scenes
A scene in Grafana Scenes is a collection of objects, called scene objects, that represent different components, such as data, time ranges, variables, layout, and visualizations. In this section, we’ll walk through the steps to compose a scene for our Loki app.
Home page of the scene
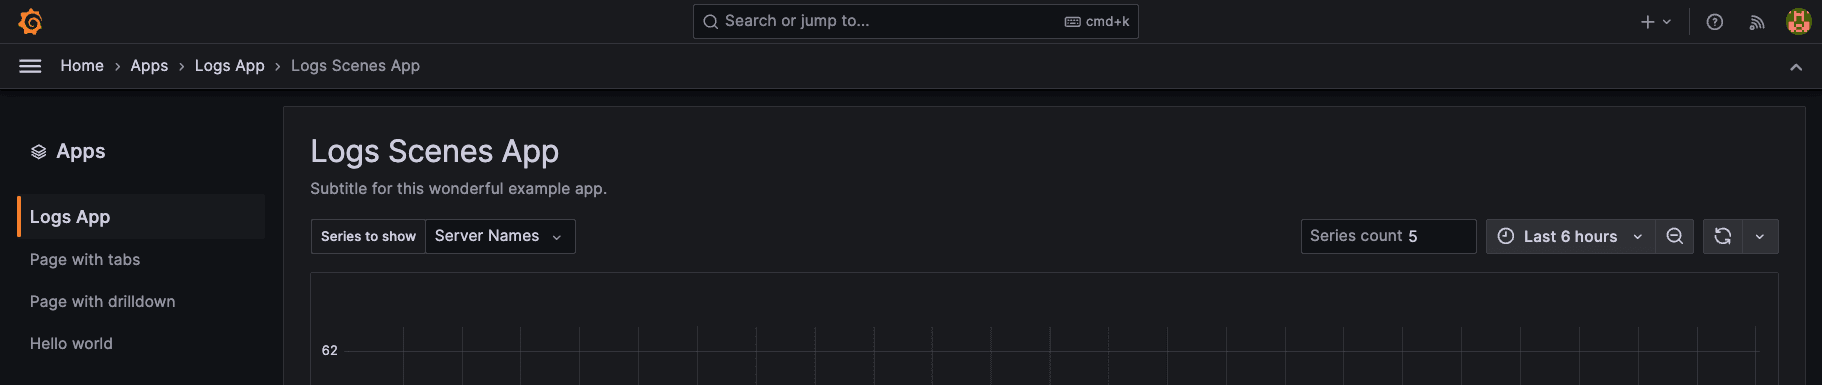
To confirm that your Grafana instance is running your project, within your instance in http://localhost:3100, go to Apps in the left-side menu. Once there, you should see a link with the name you configured when creating an empty project. The boilerplate Scenes app comes with three routes: Page with tabs, Page with drilldown, and Hello world, as seen in the screenshot below. (If you haven’t already, this would be a good time to familiarize yourself with the Scenes folder structure and the sample code that comes with it.)
For our example, we’re going to focus on the Home route located in src/pages/Home.tsx, the component that is rendered when the user browses the default page of your app plugin.
The most important objects in this component are:
SceneApp: Responsible for top-level pages routing.scene.Component: Used in render functions to render yourSceneApp.
Next, customize the title and subtitle of your app, which should be reflected in your development instance.
Lastly, we are going to add a check for the presence of a Loki data source, and ensure we display an alert if there isn’t one. While this is not essential for this example, it prevents unexpected errors and confirms that your local instance is ready for the development of your application.
import { DataSourceInstanceSettings } from '@grafana/data';

function hasLoggingDataSources(dataSources: Record<string, DataSourceInstanceSettings>) {
    return Object.entries(dataSources).some(([_, ds]) => ds.type === 'loki');
}
Then, update your HomePage component.
export const HomePage = () => {
	const scene = useMemo(() => getScene(), []);
	const hasDataSources = useMemo(
		() => hasLoggingDataSources(config.datasources),
		[]
	);

	return (
		<>
			{!hasDataSources && (
				<Alert title={`Missing logging data sources`}>
					This plugin requires a Loki data source. Please add and
					configure a Loki data source to your Grafana instance.
				</Alert>
			)}
			<scene.Component model={scene} />
		</>
	);
};
If your local environment is configured correctly, you should not see an alert. Otherwise, an error will show up:

If you do encounter this error, revisit the “Configuring a Loki data source” section above to ensure you followed all the steps.
Once everything is configured correctly, we’re ready to customize our basic scene.
Scenes for a Loki app
For this step, we will focus on the file located in src/pages/Home/scenes.tsx, where we export the getBasicScene() function to be used in the SceneAppPage in the Home page.
We begin with an essential component that is as old as the universe: time. Every request that we make needs time, and for this application, we need a time interval to retrieve the data that is stored in Loki within that range.
SceneTimeRangemanages the time selection that will be used for query requests, and in theSceneTimePickercontrol. For our example, we will create an instance that represents the time between now and one hour before. This range can be whatever you need it to be. Don’t worry about the fixed value, because we will allow the user to customize the selection.
import { SceneTimeRange } from "@grafana/scenes";

const timeRange = new SceneTimeRange({
	from: "now-1h",
	to: "now",
});
Next, we need user input. For that, we are going to use different types of controls that create variables, each one with a given name and a variable value.
DataSourceVariableallows the user to select a data source from those that are configured in this Grafana instance. When a data source is selected, a variable is created. That variable has a given name and can be interpolated in queries and in other components. You can learn more about Grafana variables, including how to add and manage them, in our documentation.
import { DataSourceVariable } from "@grafana/scenes";

const dsHandler = new DataSourceVariable({
	label: "Data source",
	name: "ds", // being $ds the name of the variable holding UID value of the selected data source
	pluginId: "loki",
});
QueryVariableallows you to display the results of a query-generated list of values, such as metric names or server names, in a dropdown. In this case, we will be asking Loki to give us the names of the stream selectors. You can read more about this in our variables and Loki documentation.
import { QueryVariable } from "@grafana/scenes";

const streamHandler = new QueryVariable({
	label: "Source stream",
	name: "stream_name", // $stream_name will hold the selected stream
	datasource: {
		type: "loki",
		uid: "$ds", // here the value of $ds selected in the DataSourceVariable will be interpolated.
	},
	query: "label_names()",
});
TextBoxVariableis an input to enter free text. In this app, we will use it to select the value of the selected stream.
import { TextBoxVariable } from "@grafana/scenes";
const streamValueHandler = new TextBoxVariable({
	label: "Stream value",
	name: "stream_value", // $stream_value will hold the user input
});
So far, we have time and user input in our variables. The next step is to use both time and user input to build queries, and there is a scene component for that.
SceneQueryRunnerwill query the selected Loki data source and provide the results to a visualization (or visualizations). Each query is a JSON object with a reference ID, or refid, and an expression with the actual query to be executed.
import { SceneQueryRunner } from "@grafana/scenes";

const queryRunner = new SceneQueryRunner({
	datasource: {
		type: "loki",
		uid: "$ds", // here the value of $ds selected in the DataSourceVariable will be interpolated.
	},
	queries: [
		{
			refId: "A",
			expr: "your query here",
		},
	],
});
And now, for the fun part: it’s time to finally visualize this data.
The PanelBuilders API provides support for building visualization objects for the supported visualization types, which for our application, are Stat, TimeSeries, and Logs.
1. Stat panel
The first visualization that we’re going to create is a stat. Stats show one large stat value with an optional graph sparkline. You can control the background or value color using thresholds or overrides. For that, we’re going to combine a QueryRunner and a PanelBuilder.
For the query, we are going to use a metric query. Loki allows you to turn your log information into time series that can be plotted in many different ways. In this example, we want to visualize the rate that these logs have over the selected period of time.
import { SceneQueryRunner, PanelBuilders } from "@grafana/scenes";
import { BigValueGraphMode } from "@grafana/schema";

const statQueryRunner = new SceneQueryRunner({
	datasource: {
		type: "loki",
		uid: "$ds",
	},
	queries: [
		{
			refId: "A",
			expr: 'sum(rate({$stream_name="$stream_value"} [$__auto]))',
		},
	],
});

const statPanel = PanelBuilders.stat()
	.setTitle("Logs rate / second")
	.setData(statQueryRunner)
	.setOption("graphMode", BigValueGraphMode.None)
	.setOption("reduceOptions", {
		values: false,
		calcs: ["mean"],
		fields: "",
	});
Like we mentioned earlier, the variables in the query sum(rate({$stream_name="$stream_value"} [$__auto])) are going to be replaced with user input. $__autois a Grafana variable that provides the appropriate value for the duration of your rate() query.
Note:Depending on the version of Grafana, $__auto may not be available. If your query returns an error, try $__interval.
For the panel, the Scenes API is expressive and self-explanatory, but we can go over each step:
- Request a
StatfromPanelBuilder. - Provide a title.
- Tell it where to get the data.
- Tell it that we don’t want to see the sparklines, just the big number.
- Provide some customizations around how to treat the data.
This last customization will tell the stat panel to calculate the mean of the provided values. Since metric queries return time series, and the stat panel can only display a single numerical value, in this example we’re interested in seeing the mean of all values.
2. Time series
The second visualization we’re going to use is a TimeSeries panel, because we want to see how data changes over a period of time.
import { SceneQueryRunner, PanelBuilders } from "@grafana/scenes";

const timeSeriesQueryRunner = new SceneQueryRunner({
	datasource: {
		type: "loki",
		uid: "$ds",
	},
	queries: [
		{
			refId: "B",
			expr: 'count_over_time({$stream_name="$stream_value"} [$__auto])',
		},
	],
});

const timeSeriesPanel = PanelBuilders.timeseries()
	.setTitle("Logs over time")
	.setData(timeSeriesQueryRunner);
This one is simpler, and repeats a pattern similar to the one we used for the stats, but without any customization. We like it as it is.
3. Logs panel
And finally, the cherry on top: a logs panel. The recipe is the same: a log query + a log visualization.
import { SceneQueryRunner, PanelBuilders } from "@grafana/scenes";

const logsQueryRunner = new SceneQueryRunner({
	datasource: {
		type: "loki",
		uid: "$ds",
	},
	queries: [
		{
			refId: "A",
			expr: '{$stream_name="$stream_value"}',
			maxLines: 20, // Use up to 5000
		},
	],
});

const logsPanel = PanelBuilders.logs()
	.setTitle("Logs")
	.setData(logsQueryRunner);
Arrange the scenes
We now have all the required building blocks to create our application. The final act requires passing all these objects to the Scenes library and defining how to organize them in the UI.
To arrange the items, we will use a grid layout. This is the default behavior of dashboards in Grafana, and grid layout lets you add a similar experience to your scene. We will use three SceneGridItem components inside one SceneGridLayout.
To pass the variables to our scene, we will put them in a SceneVariableSet.
Finally, we will arrange the scene so that the user has access to some controls, namely:
VariableValueSelectorsto modify the variable controls.SceneControlsSpacerto add a little bit of air between objects.SceneTimePickerto customize the time selection.
The end result should be as follows:
export function getBasicScene() {
	// Everything before goes over here
	return new EmbeddedScene({
		$timeRange: timeRange,
		$variables: new SceneVariableSet({
			variables: [dsHandler, streamHandler, streamValueHandler],
		}),
		body: new SceneGridLayout({
			children: [
				new SceneGridItem({
					height: 8,
					width: 8,
					x: 0,
					y: 0,
					body: statPanel.build(),
				}),
				new SceneGridItem({
					height: 8,
					width: 16,
					x: 8,
					y: 0,
					body: timeSeriesPanel.build(),
				}),
				new SceneGridItem({
					height: 8,
					width: 24,
					x: 0,
					y: 4,
					body: logsPanel.build(),
				}),
			],
		}),
		controls: [
			new VariableValueSelectors({}),
			new SceneControlsSpacer(),
			new SceneTimePicker({ isOnCanvas: true }),
		],
	});
}
And if all went well, you should see something like this:

As a final note, don’t forget to enter a value for the stream value input, so Loki knows what data to get.
Wrapping up
There’s so, so much more that we could say about plugins, Scenes, and Loki, but that would be a book — not a blog post.
Hopefully you learned how easy it is to build a Grafana plugin, how expressive the Scenes library is when it comes to building dynamic user interfaces with visualizations, and how you can combine these concepts with Grafana Loki to create an application that works with logs. You can learn more about creating a logs app plugin in this GitHub repo.
You can also learn more about Grafana Scenes — which became generally available in September — by checking out this recent Grafana Office Hours episode.
Thanks for following along!
The easiest way to get started with Grafana is with Grafana Cloud, which has a generous forever-free tier and plans for every use case. Sign up for free today!

